
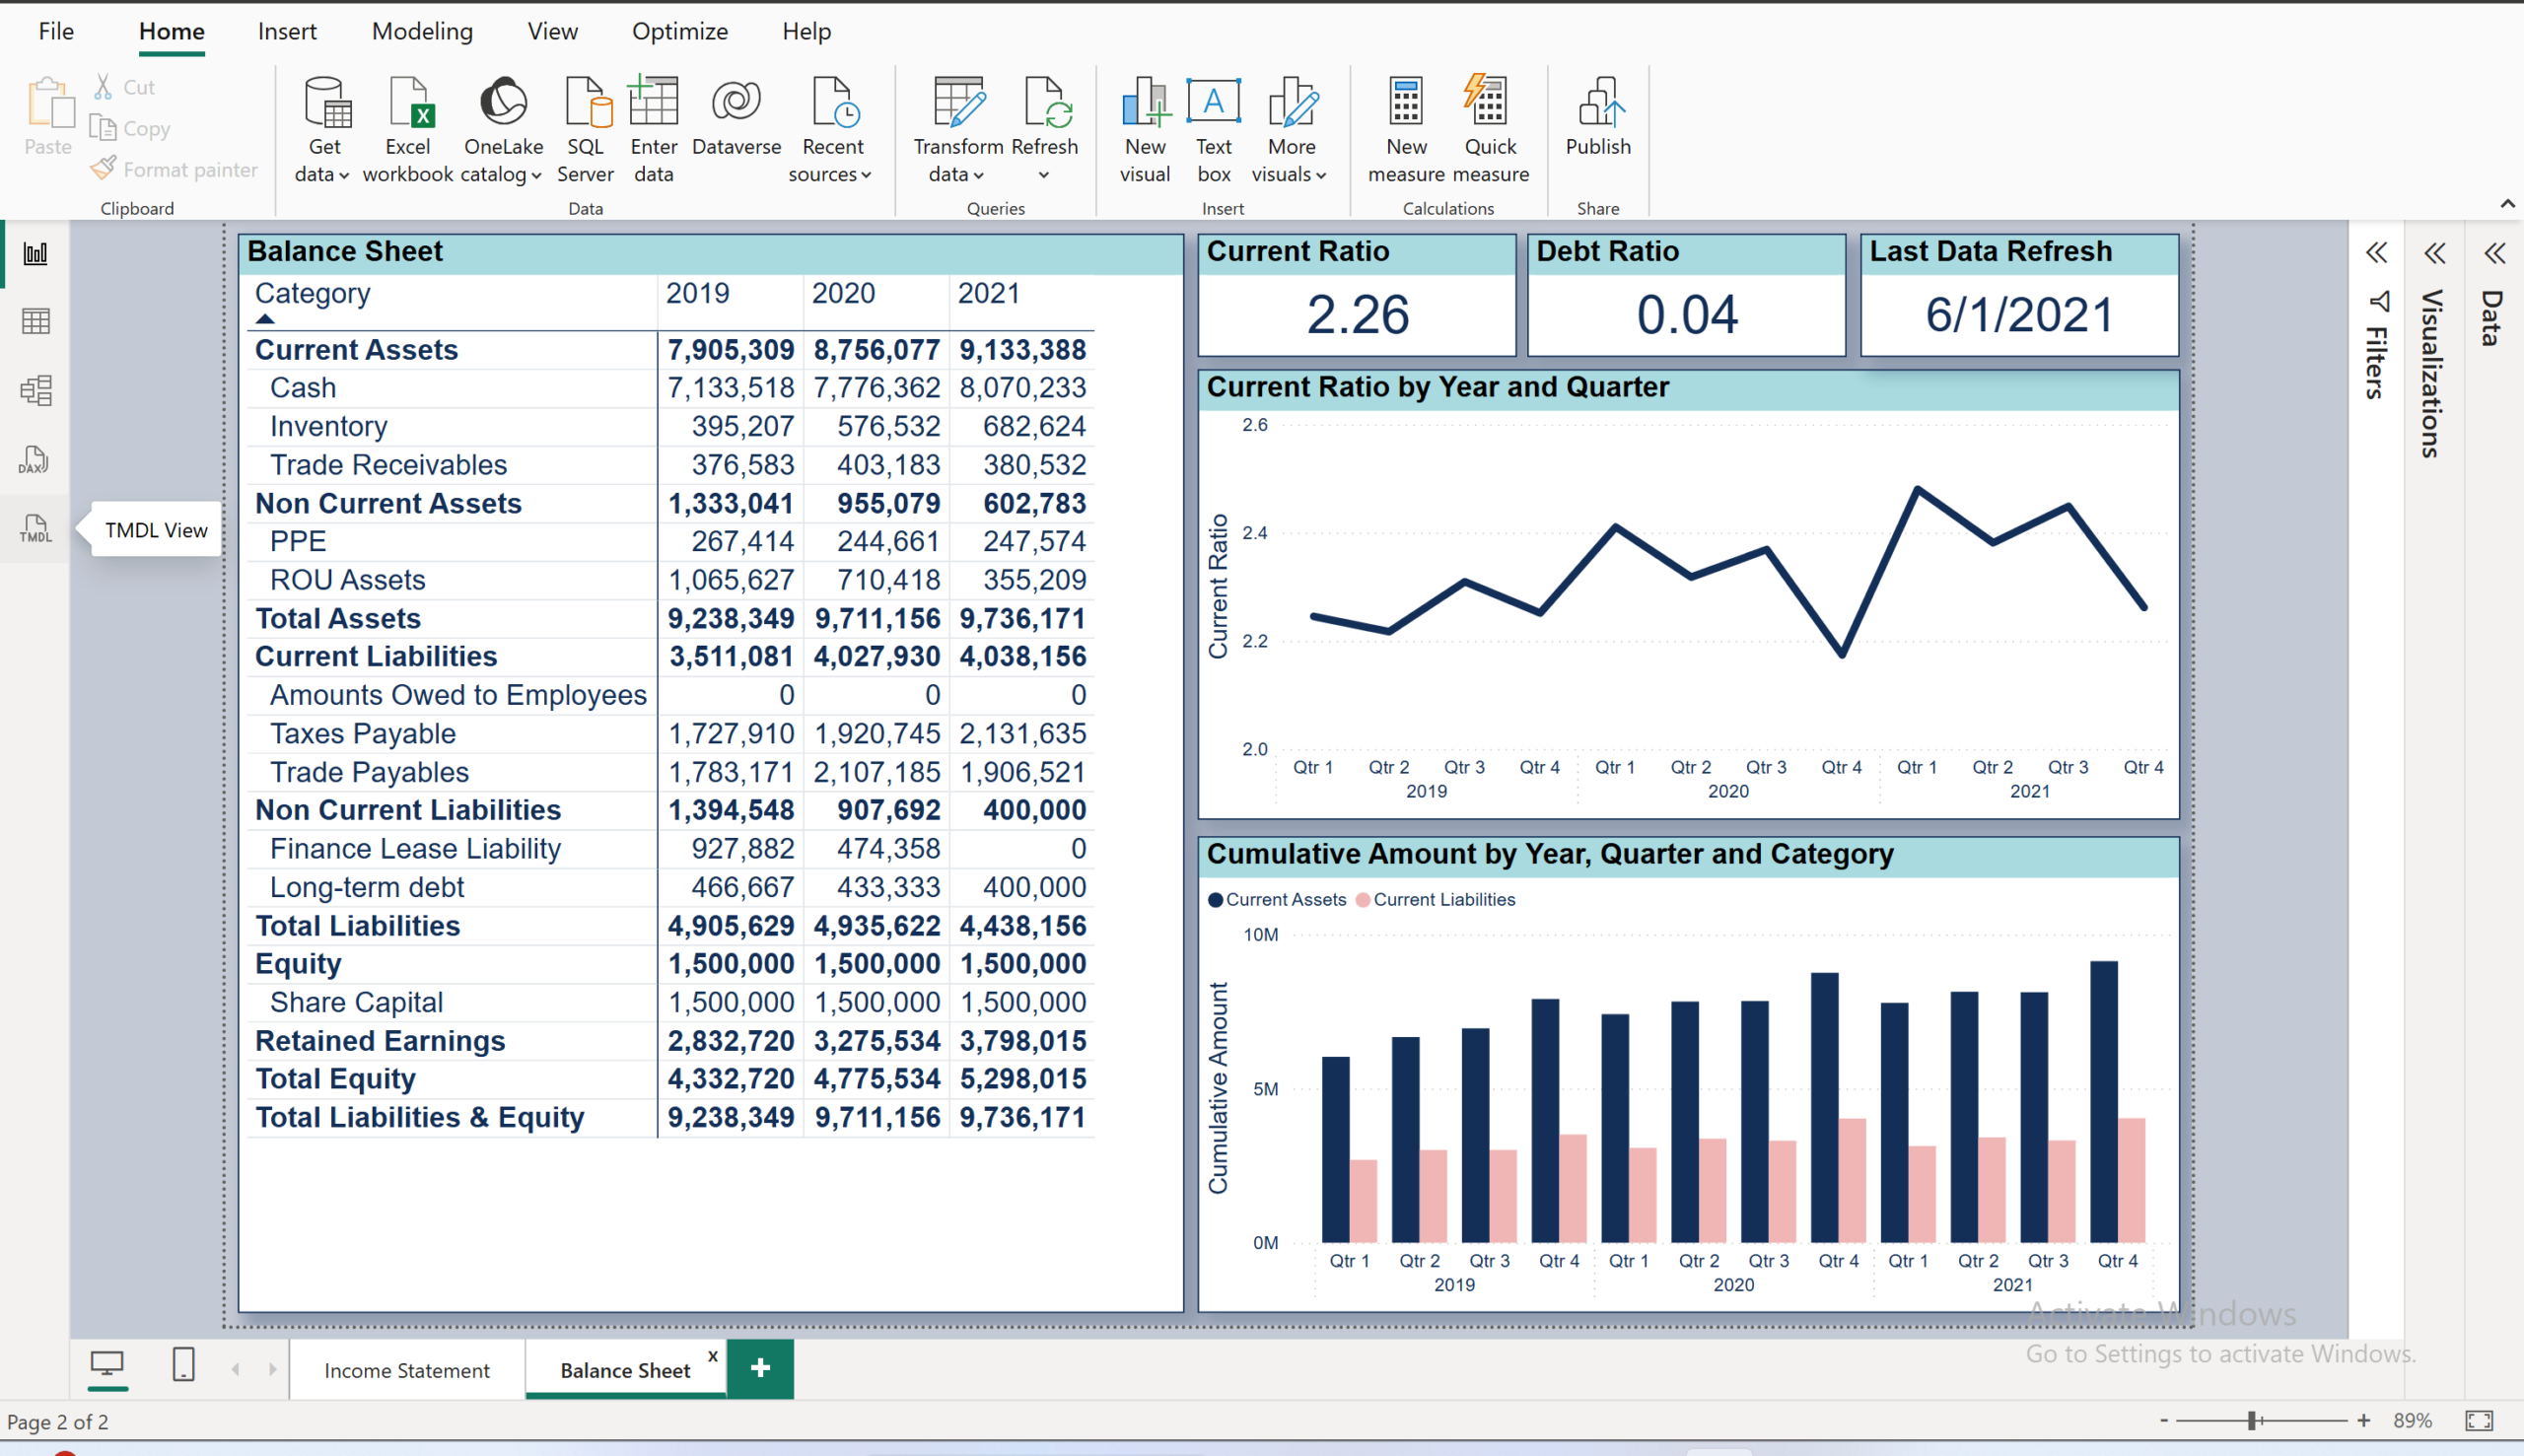
I have completed the second part of your financial analysis project by creating a Balance Sheet dashboard, which visually represents the company’s financial position across 2019, 2020, and 2021. The dashboard features a comprehensive Balance Sheet table detailing assets, liabilities, and equity, allowing for year-over-year comparison. Crucially, you calculated and displayed key liquidity and leverage ratios, specifically the Current Ratio (2.26) and the Debt Ratio (0.04). To provide deeper insight into trends, the dashboard includes a line chart tracking the Current Ratio over time by quarter, and a bar chart comparing the cumulative amounts of Current Assets versus Current Liabilities, effectively summarizing the balance sheet’s health and trends.https://samad-majidiprojects.website/wp-content/uploads/2025/12/Balance-Sheet-project-03-scaled.png
Project 03.2
I have completed the second part of your financial analysis project by creating a Balance Sheet dashboard, which visually represents the company’s financial position across 2019, 2020, and 2021. The…