

projects
-
Project 07_ETL_Pipeline
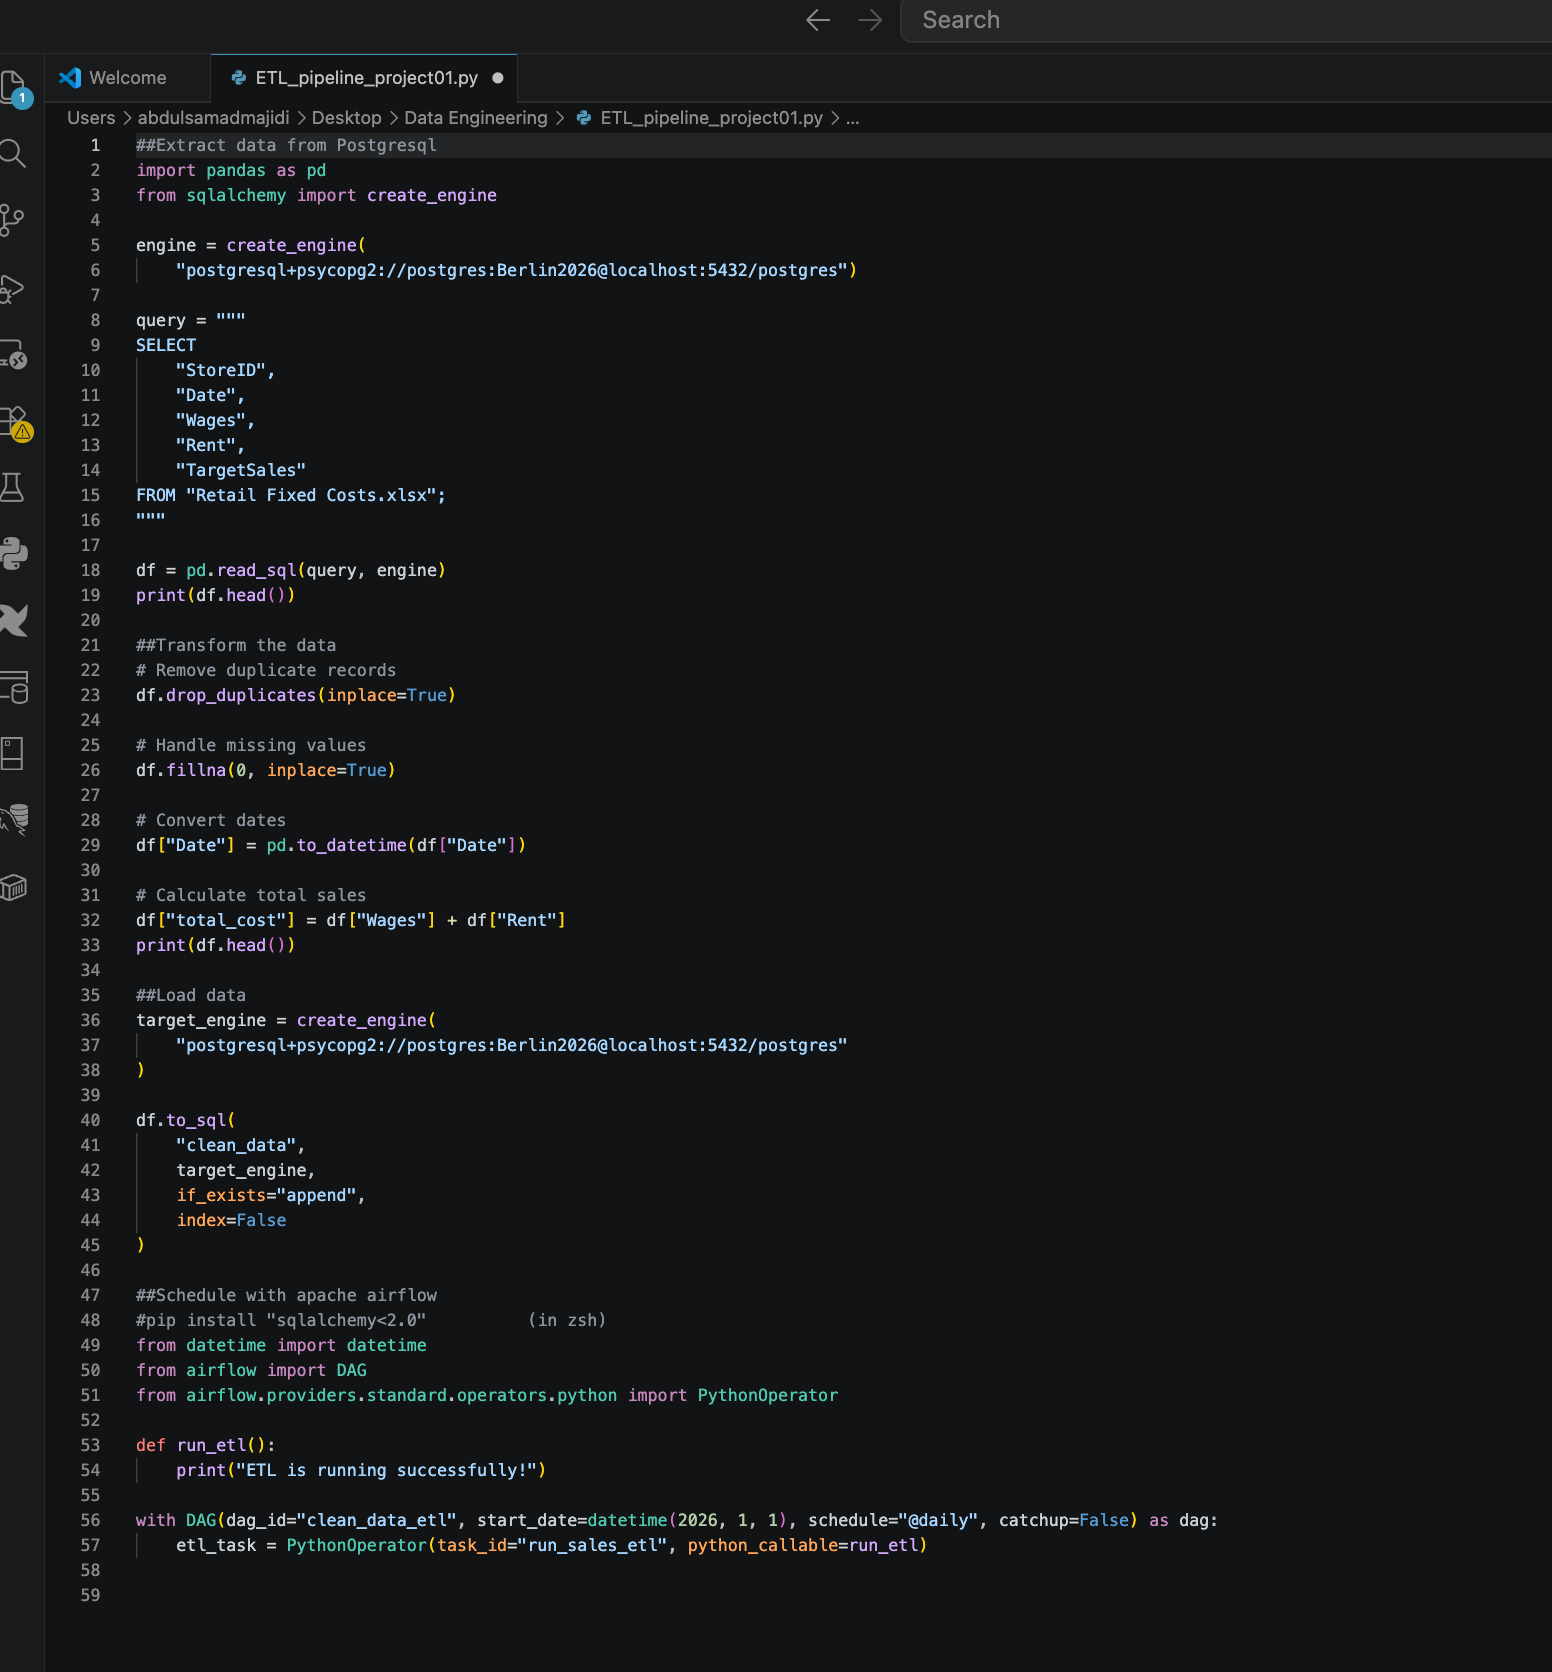
I developed a nightly ETL pipeline using Apache Airflow and Python. Airflow orchestrated the workflow and triggered a Python ETL script every night. The script connected to an on-premises PostgreSQL database using SQLAlchemy, extracted order data into a Pandas DataFrame, removed duplicates, handled missing values, validated records, converted date formats, and calculated business metrics such…
-
Project 6 (SQL Server)
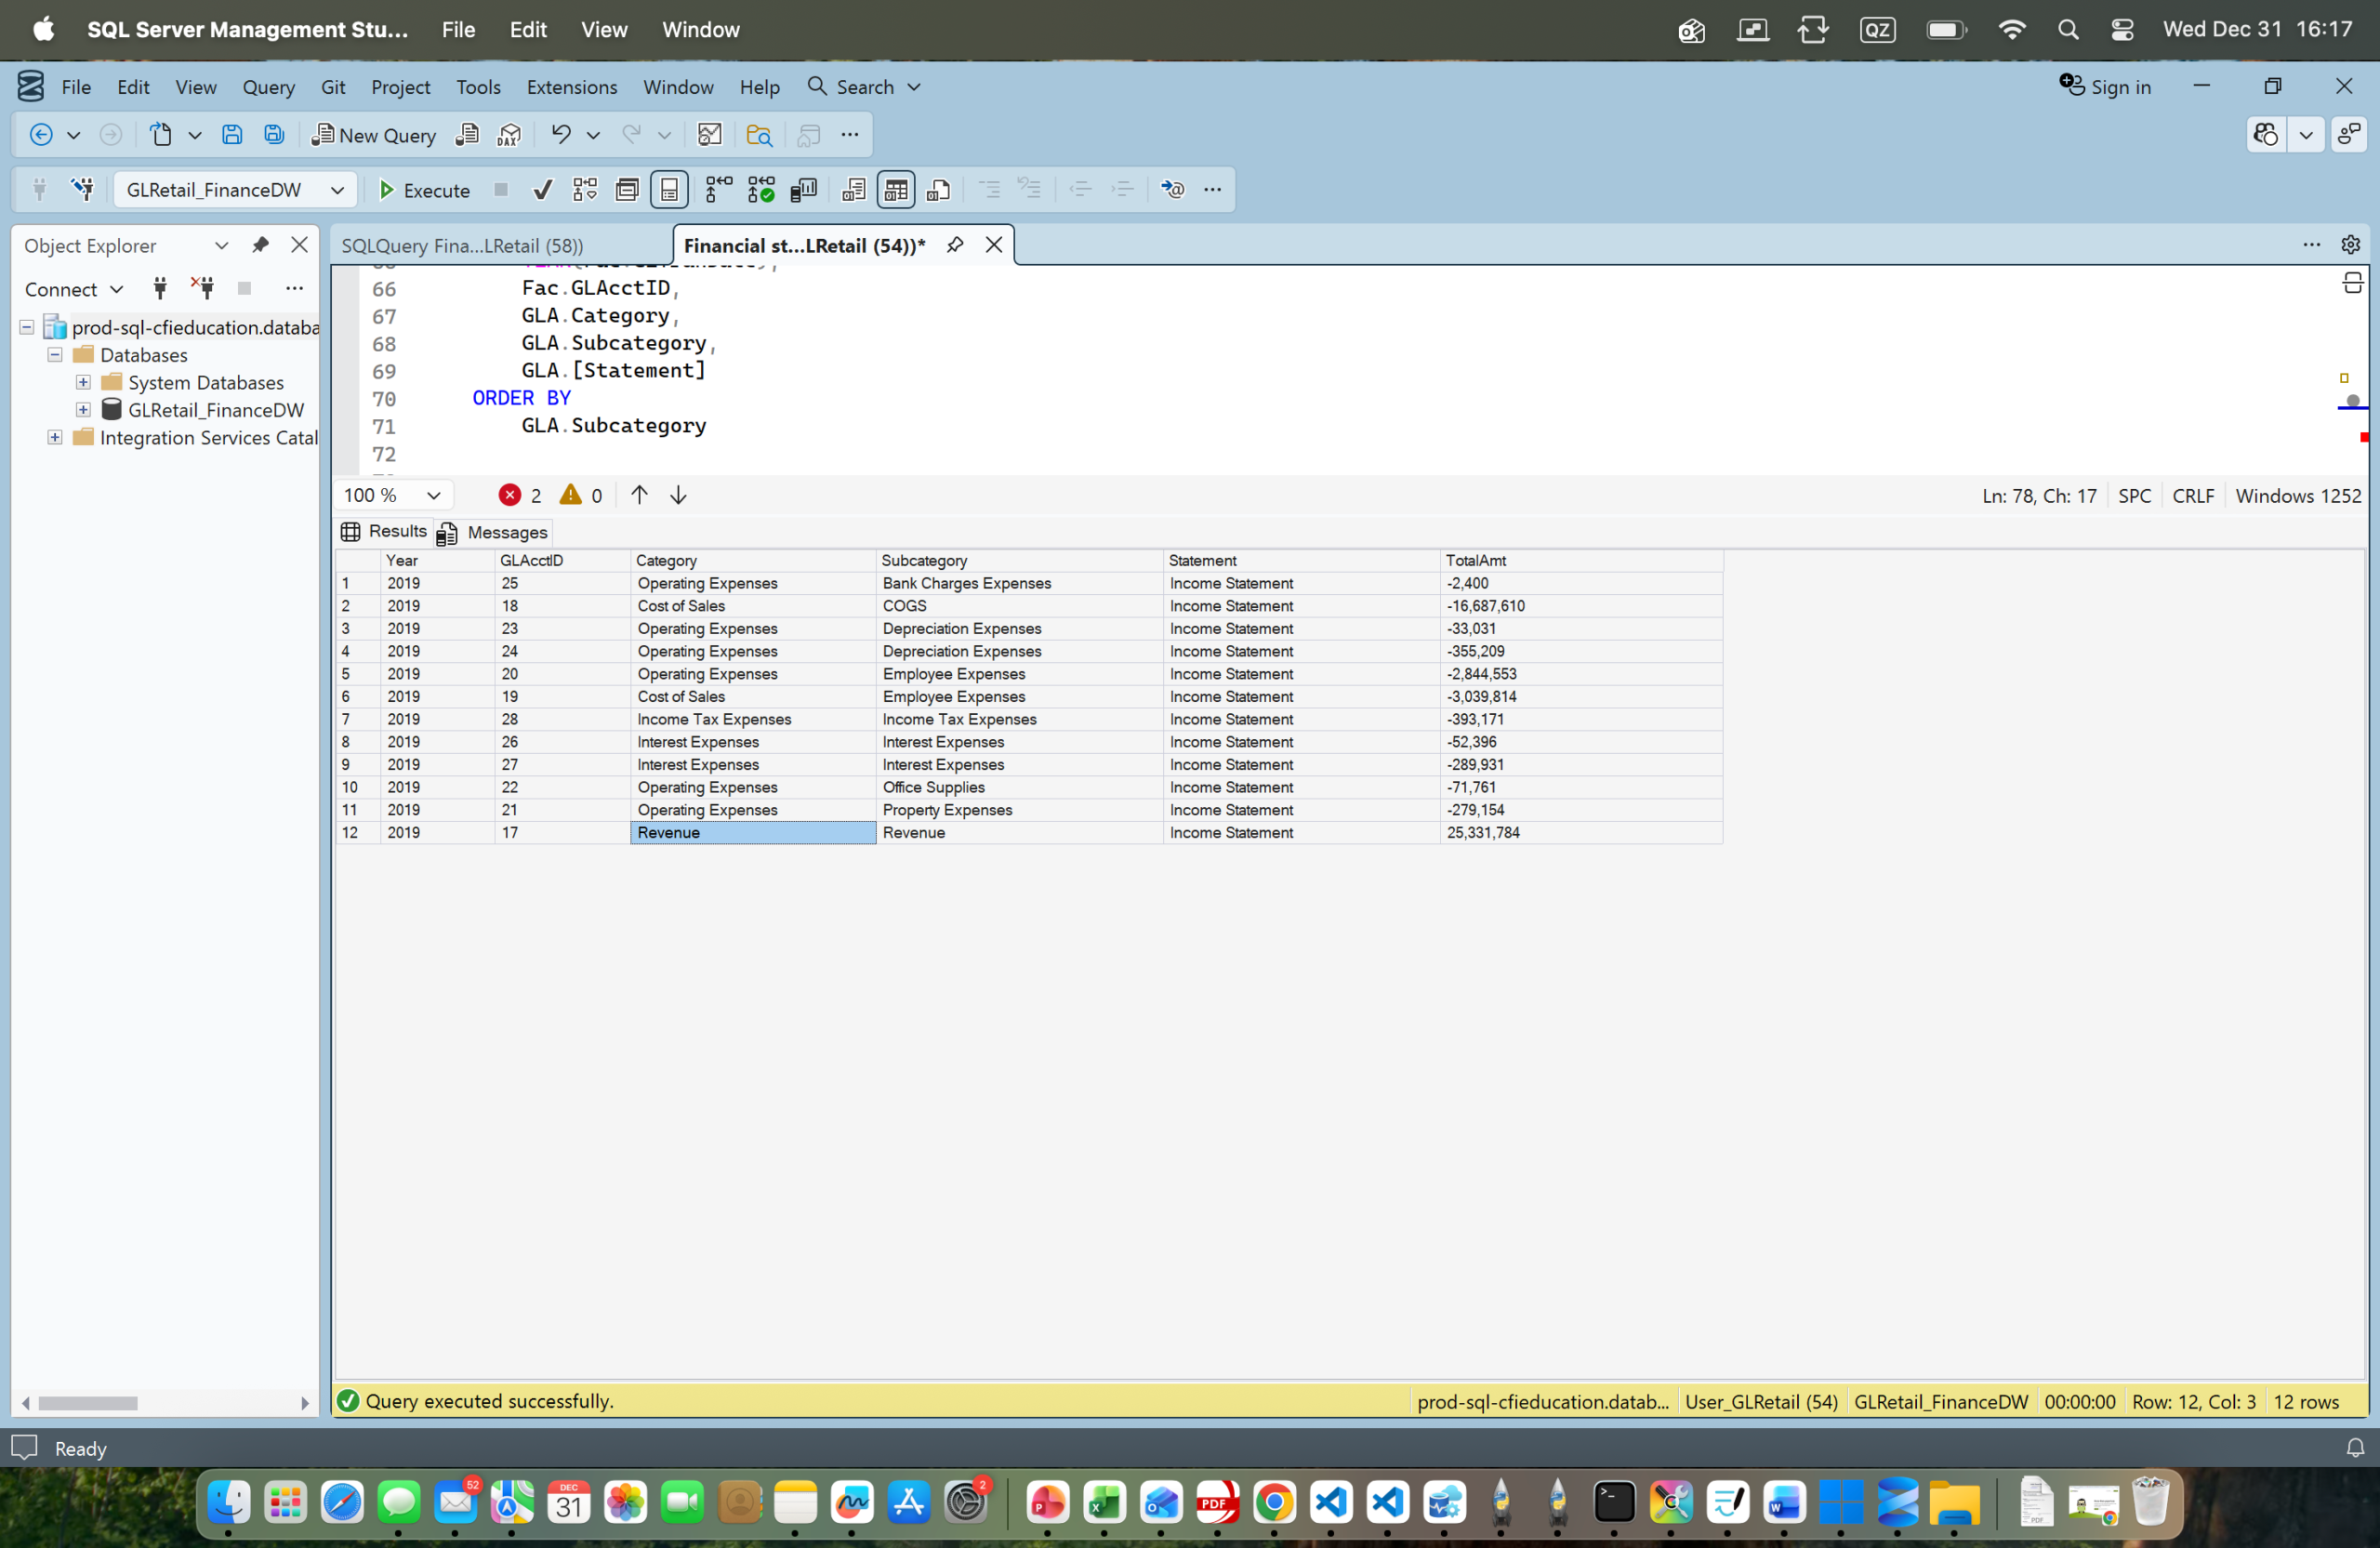
I have used SQL Server Management Studio to query a financial data warehouse, extracting summarized income statement data by year, GL account, category, and subcategory. The query aggregates transaction amounts into a clean, ordered result set that standardizes revenues and expenses, producing a structured income statement table that serves as the source layer for downstream…
-
Project 5 (RStudio )
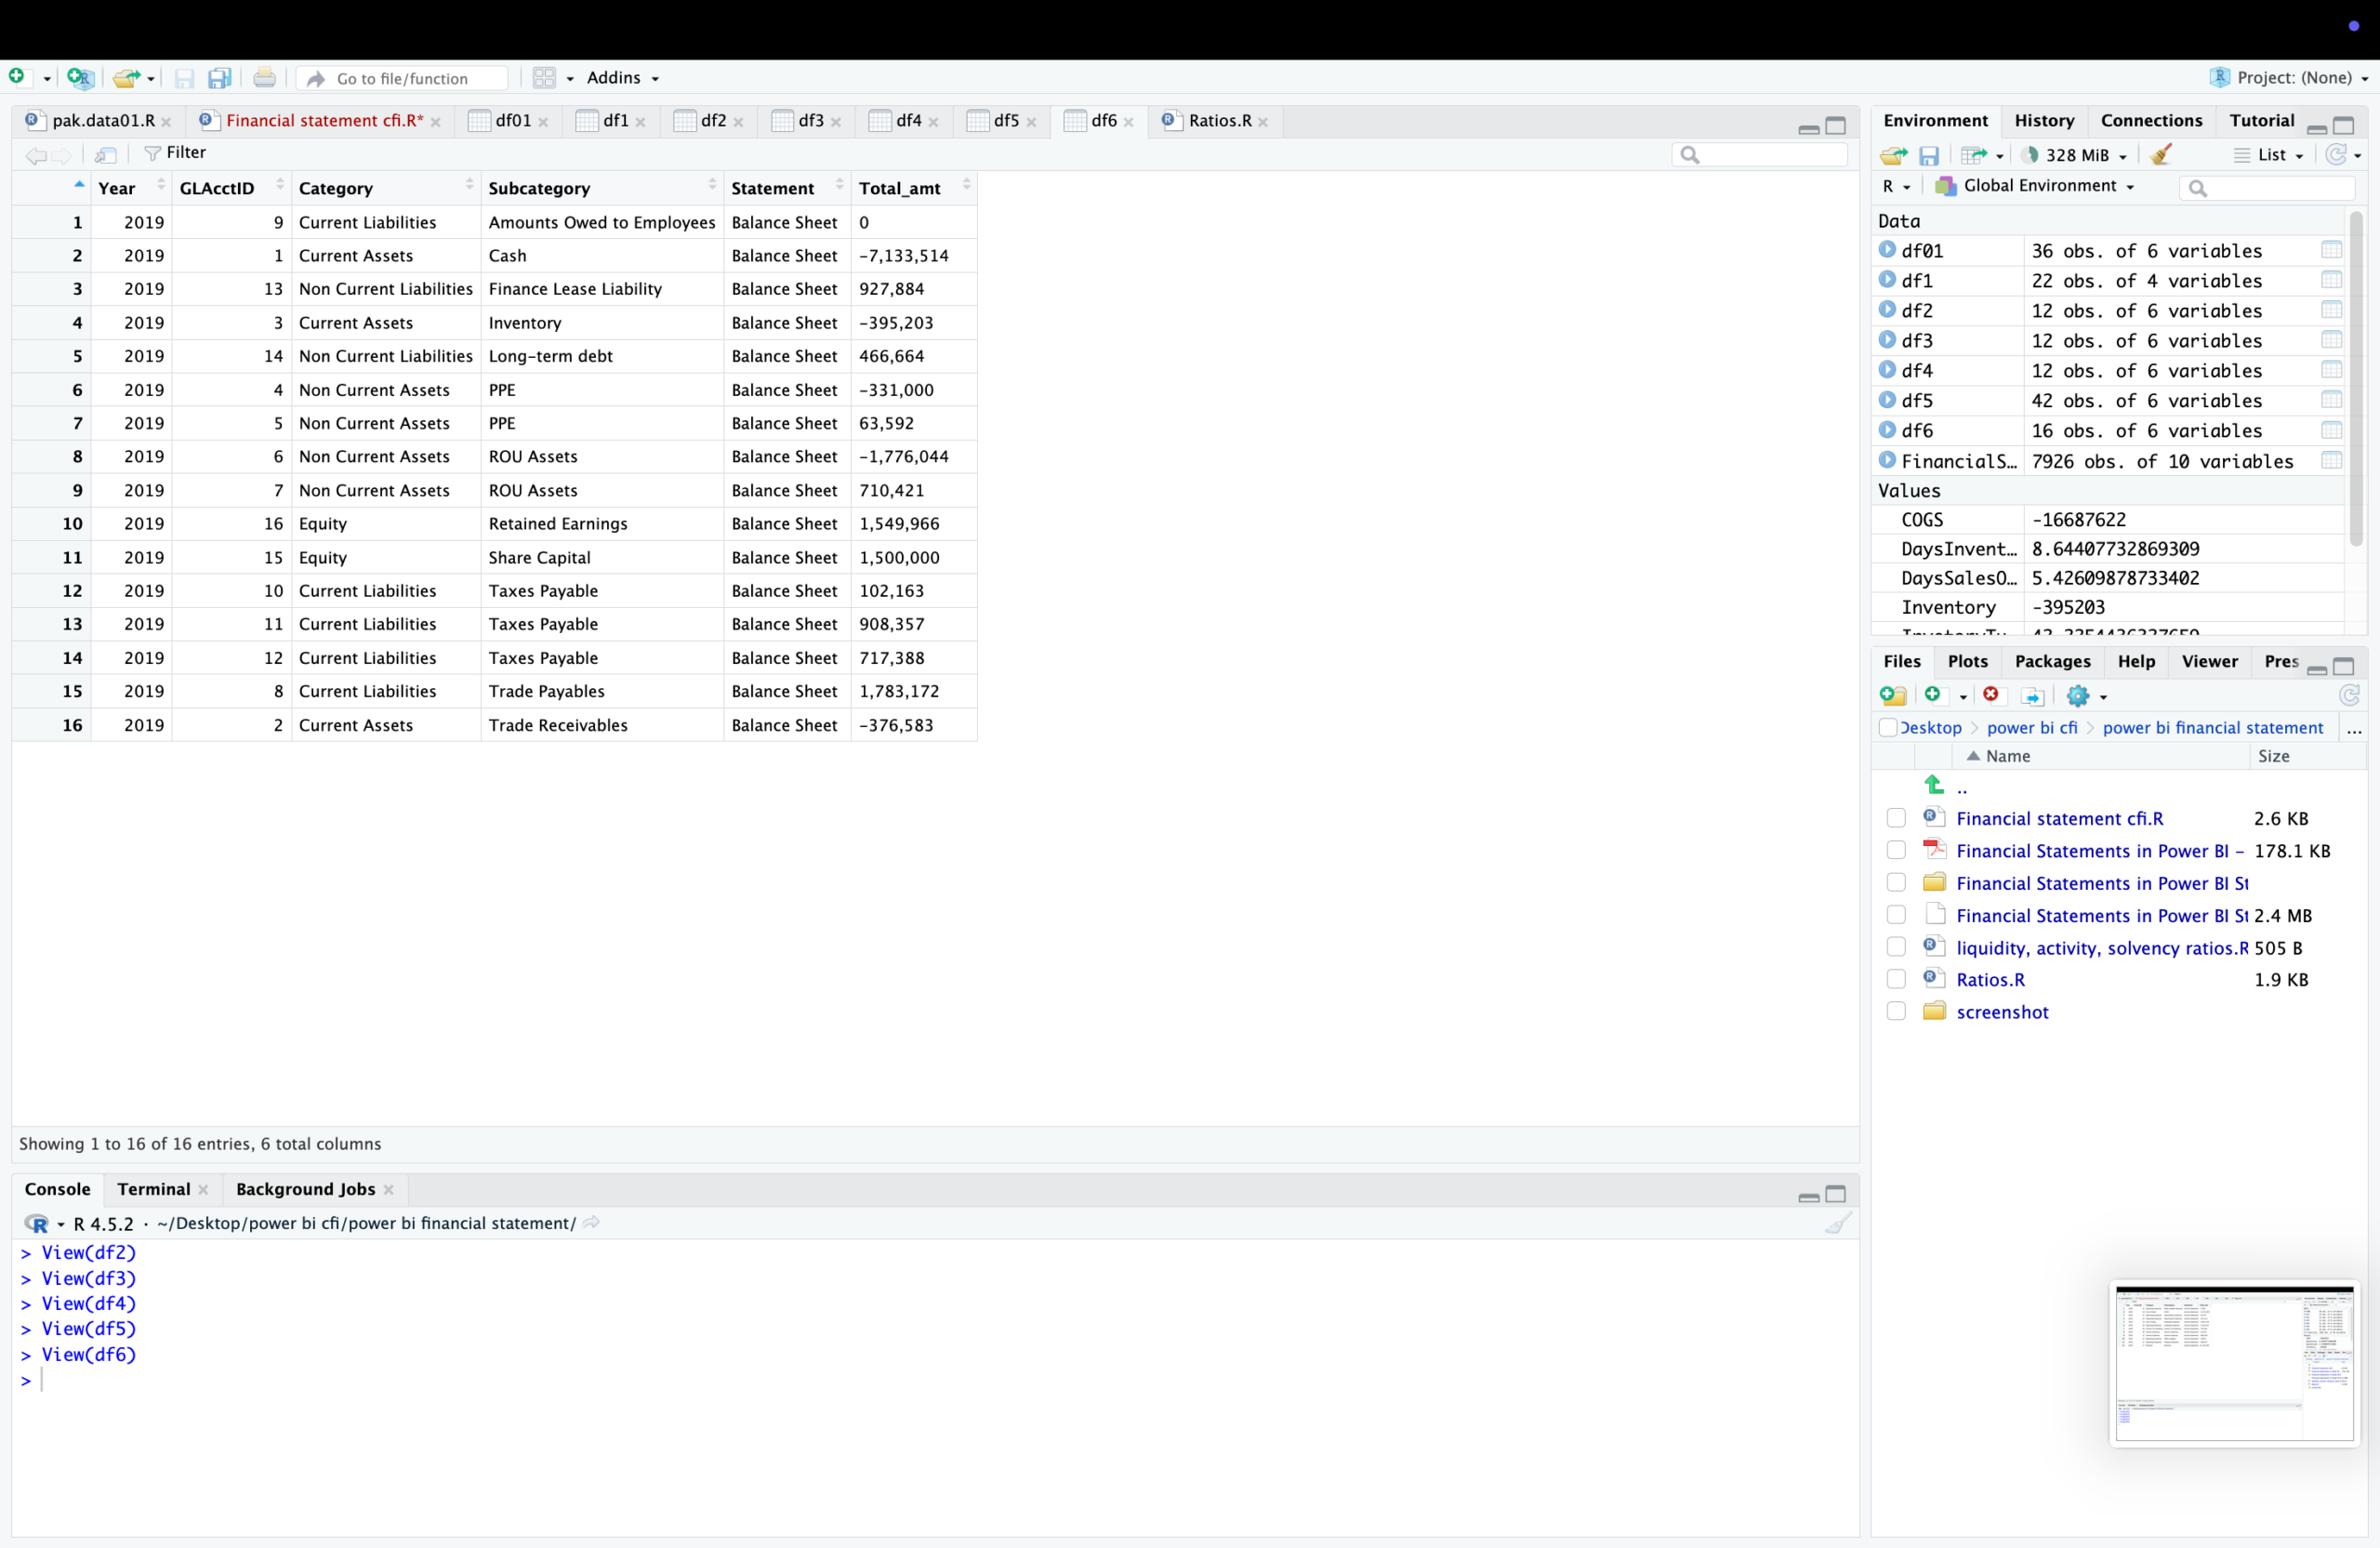
I have used RStudio to explore and clean multiple financial data frames, viewing several intermediate tables before consolidating them into a structured income statement dataset. The data is organized by year, account, category, and subcategory, with revenues and expenses properly signed. Also I have used RStudio to review and organize balance sheet data by viewing…
-
Projectb 04
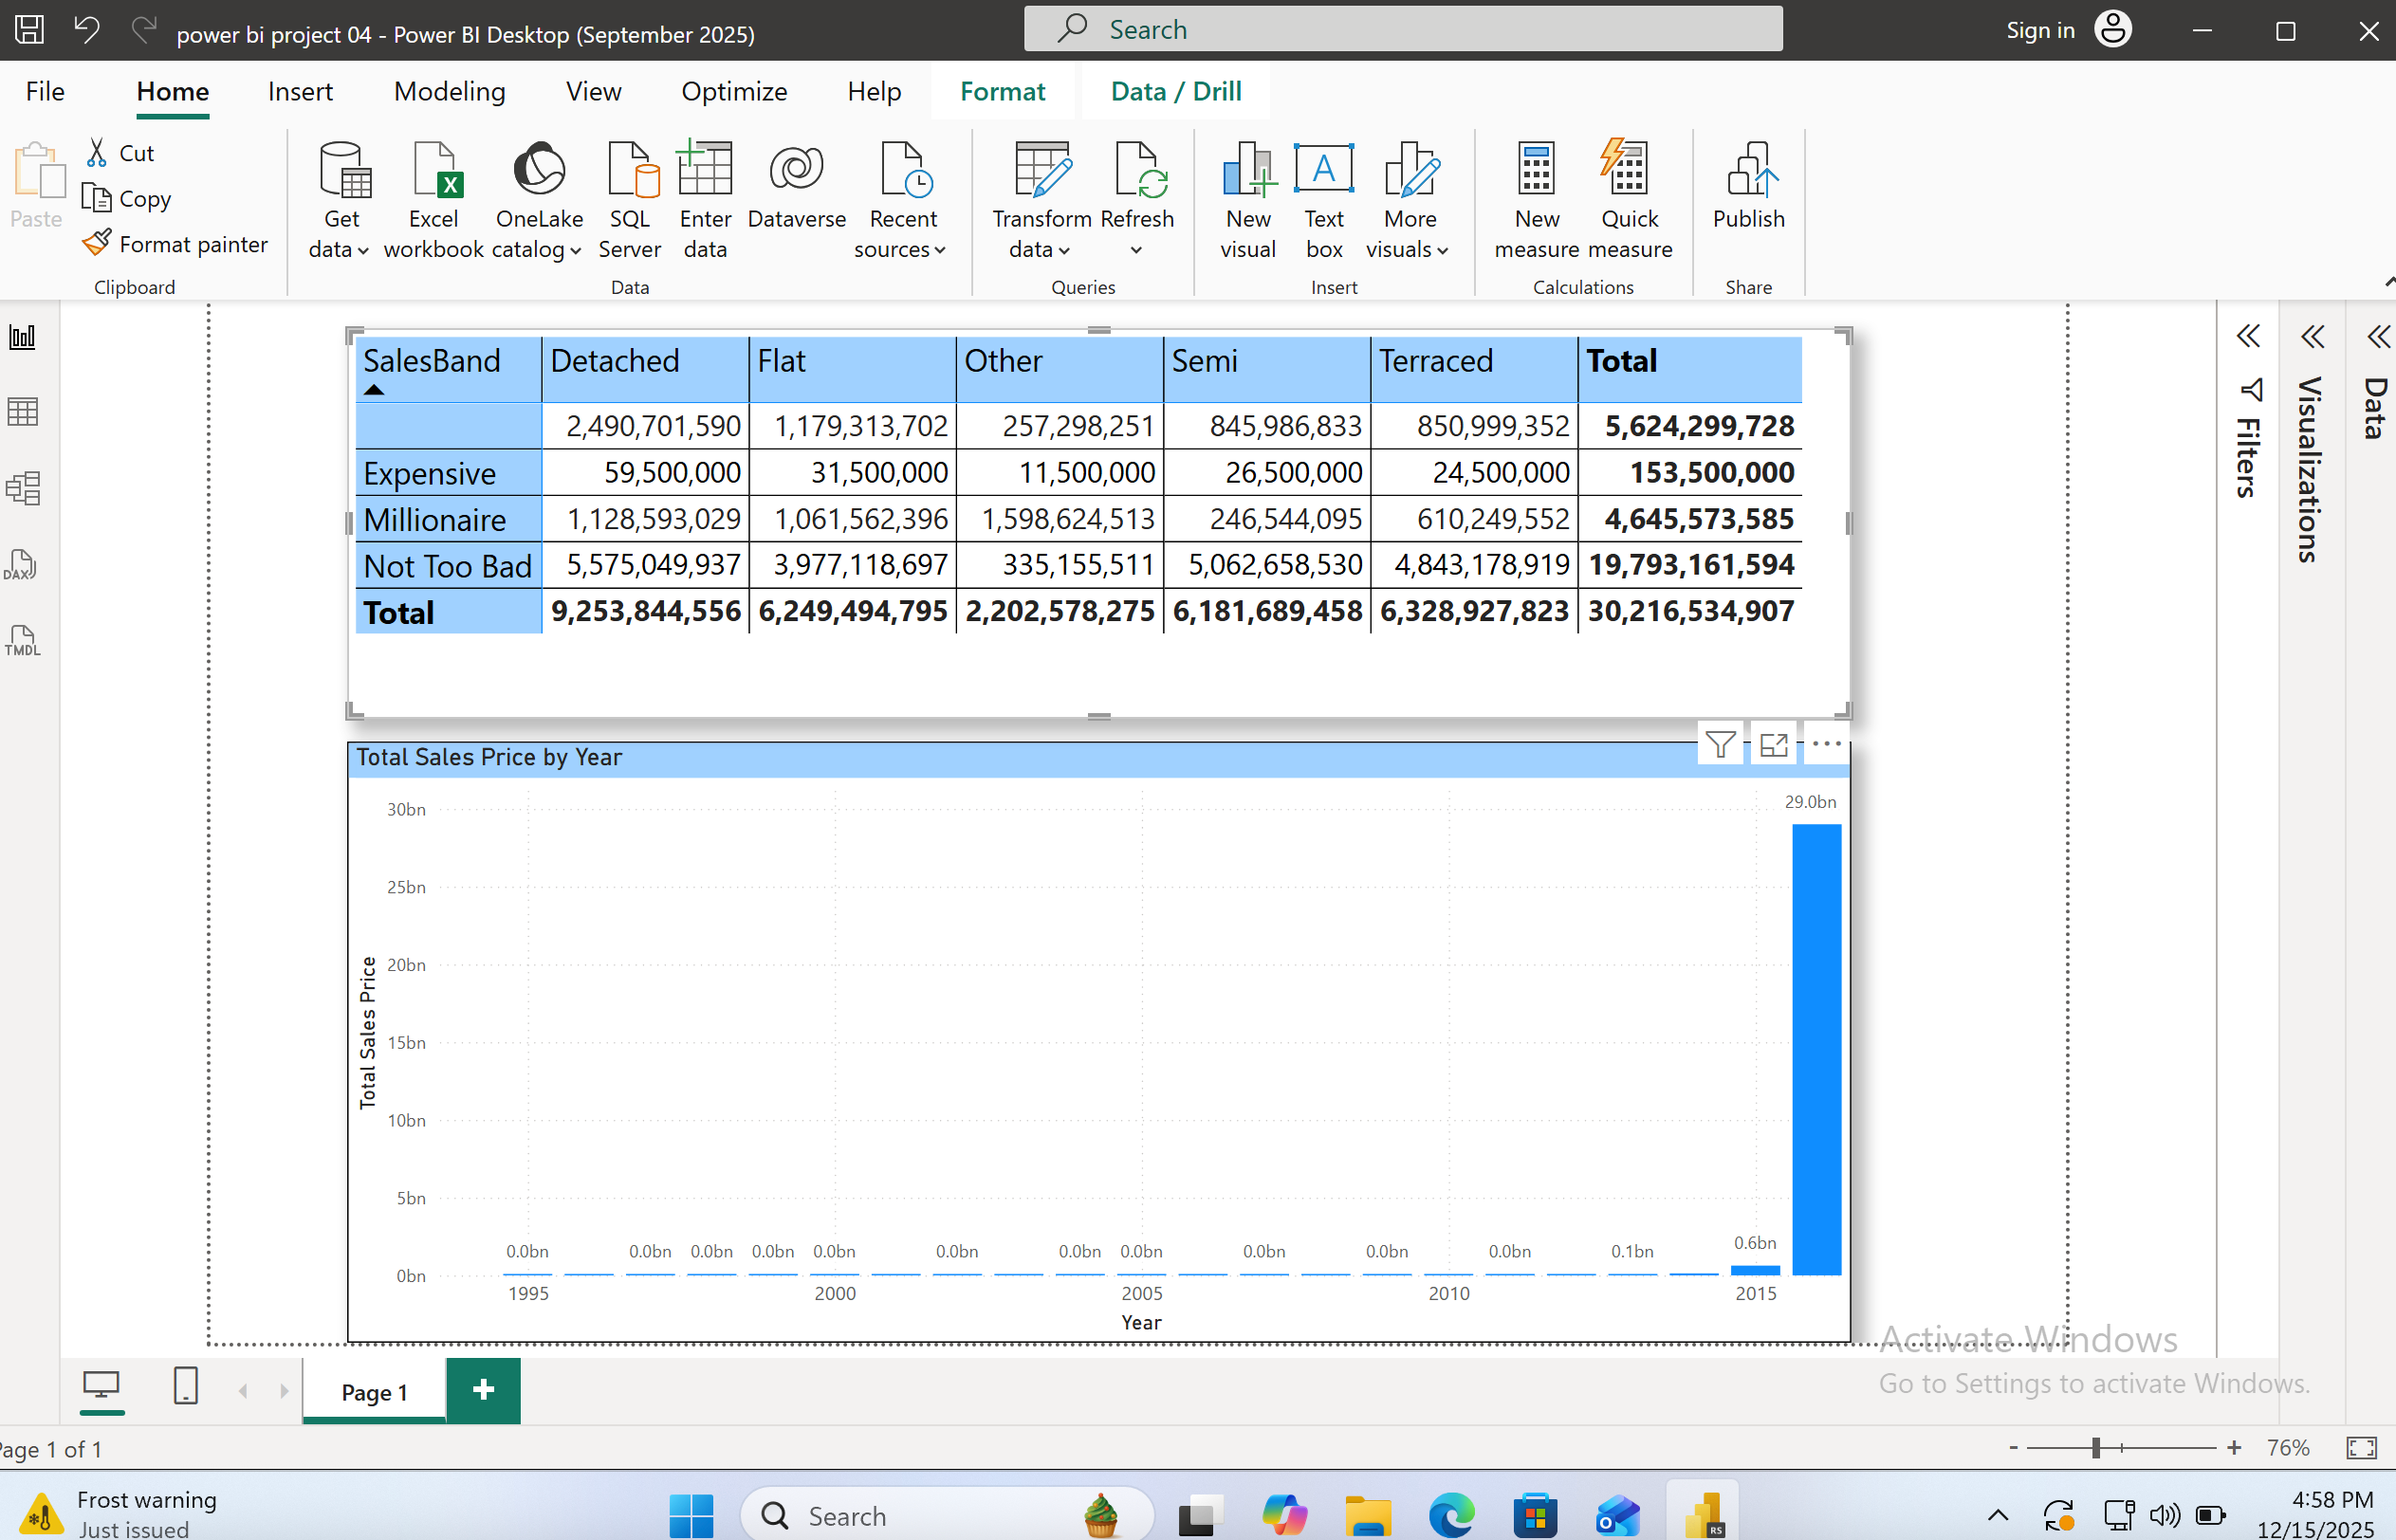
I have generated a concise Sales Performance report, within a business intelligence Power BI. The core of this report is a Matrix table that cross-analyzes Sales Band (Expensive, Millionaire, Not Too Bad) against Property Type (Detached, Flat, Other, Semi, Terraced), showing the total sales price for each combination. This table summarizes the entire sales history,…
-
Project 03.2
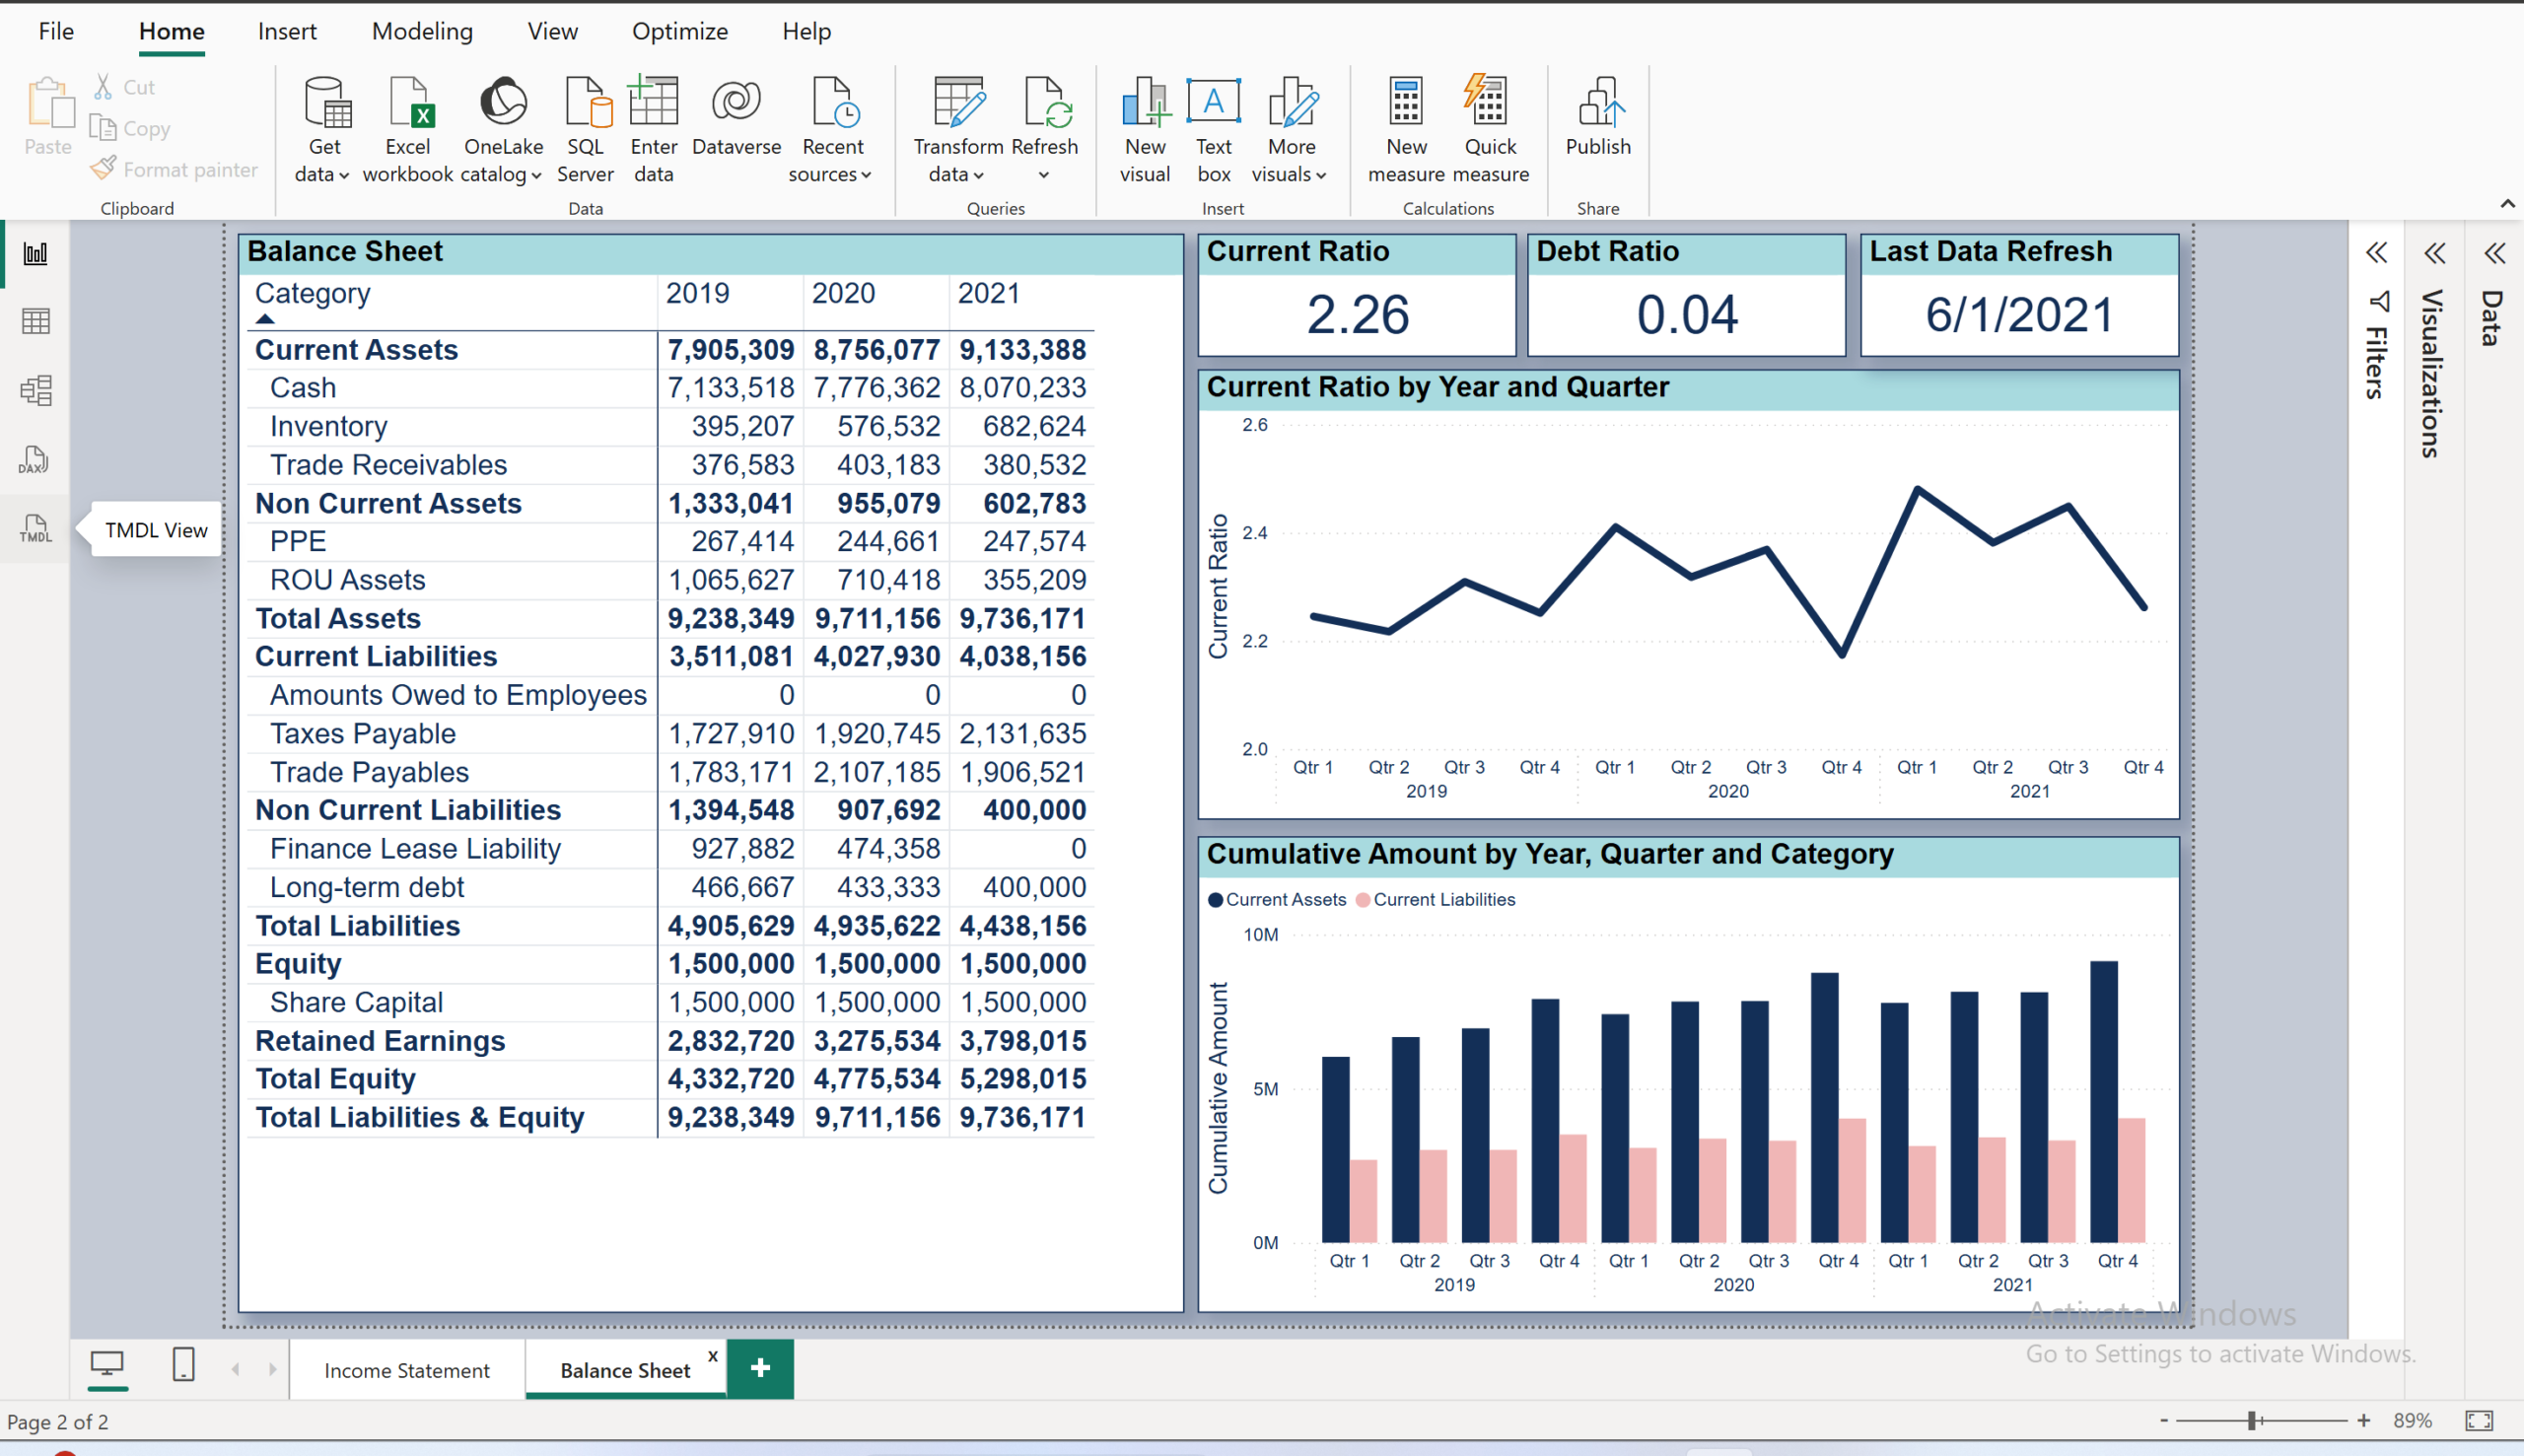
I have completed the second part of your financial analysis project by creating a Balance Sheet dashboard, which visually represents the company’s financial position across 2019, 2020, and 2021. The dashboard features a comprehensive Balance Sheet table detailing assets, liabilities, and equity, allowing for year-over-year comparison. Crucially, you calculated and displayed key liquidity and leverage…
-
Project 03.1
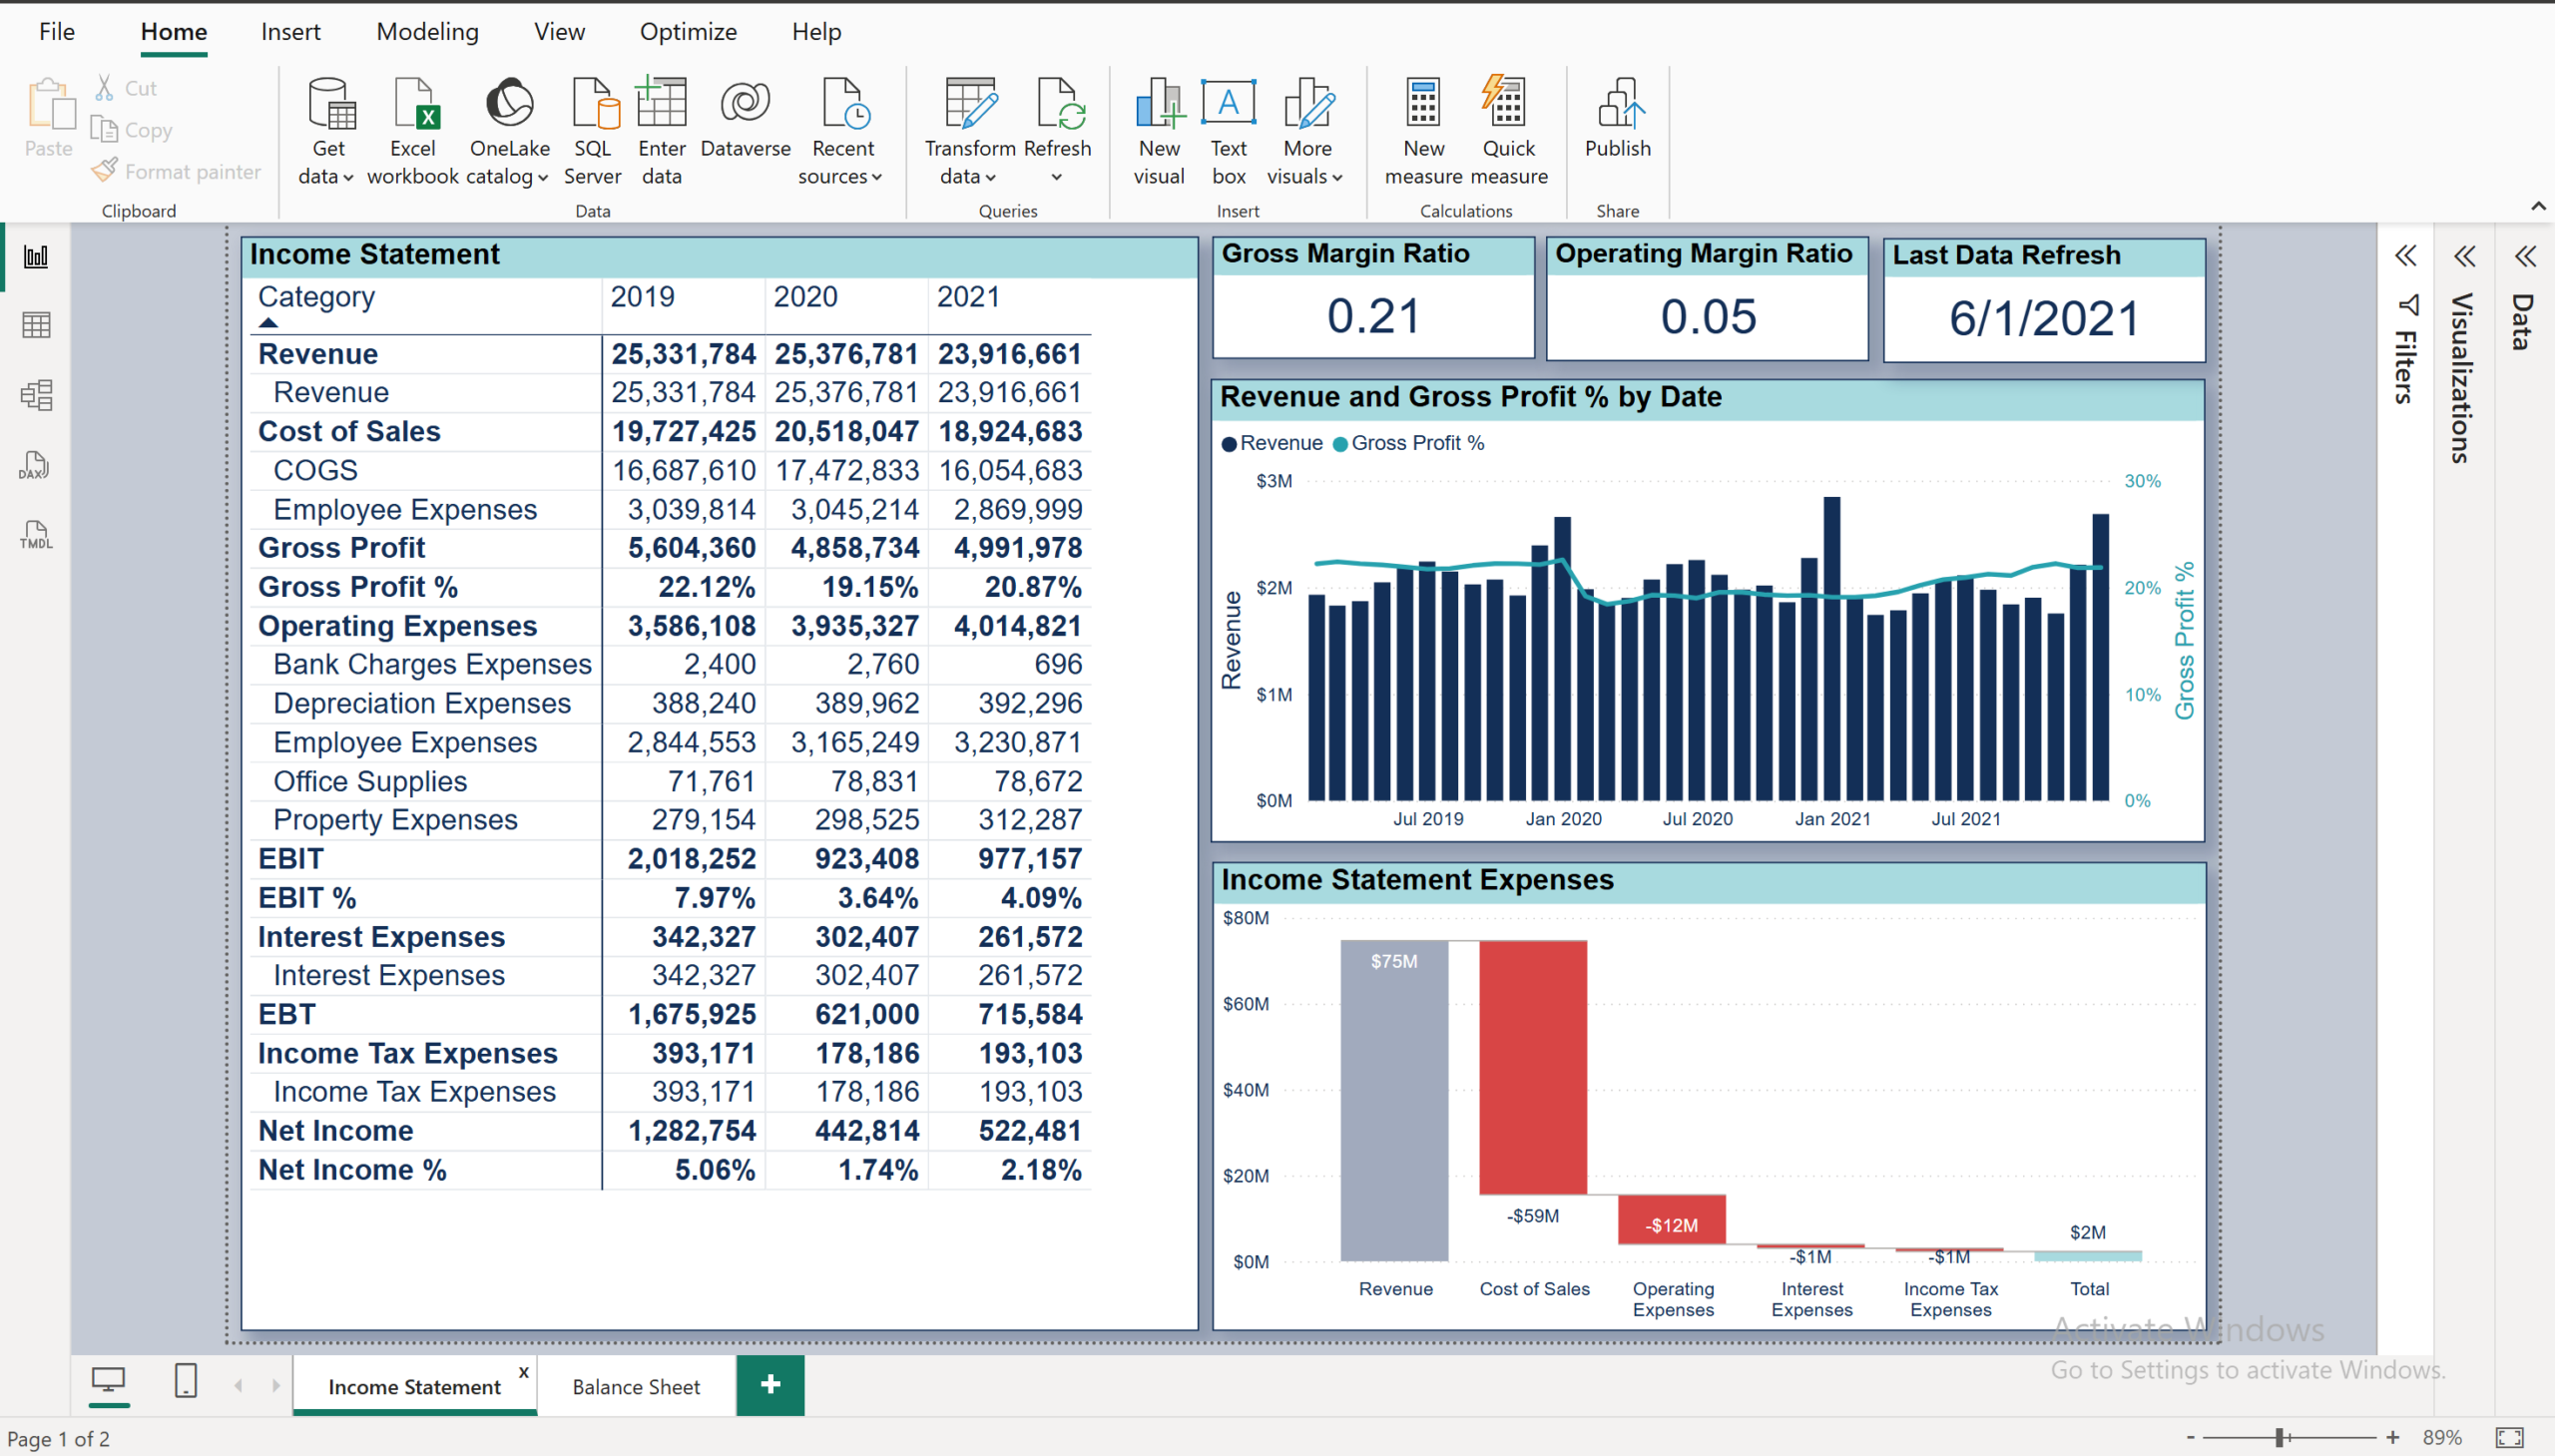
I have created a dynamic Income Statement dashboard using Power BI visualizing financial performance from 2019 to 2021. The dashboard combines a detailed Income Statement table with key figures, highlights vital ratios (Gross Margin: 0.21, Operating Margin: 0.05), and includes visual charts for Revenue/Gross Profit trends and a breakdown of major Expenses.https://samad-majidiprojects.website/wp-content/uploads/2025/12/Income-Statement-project-03-scaled.png
-
Project 02.2
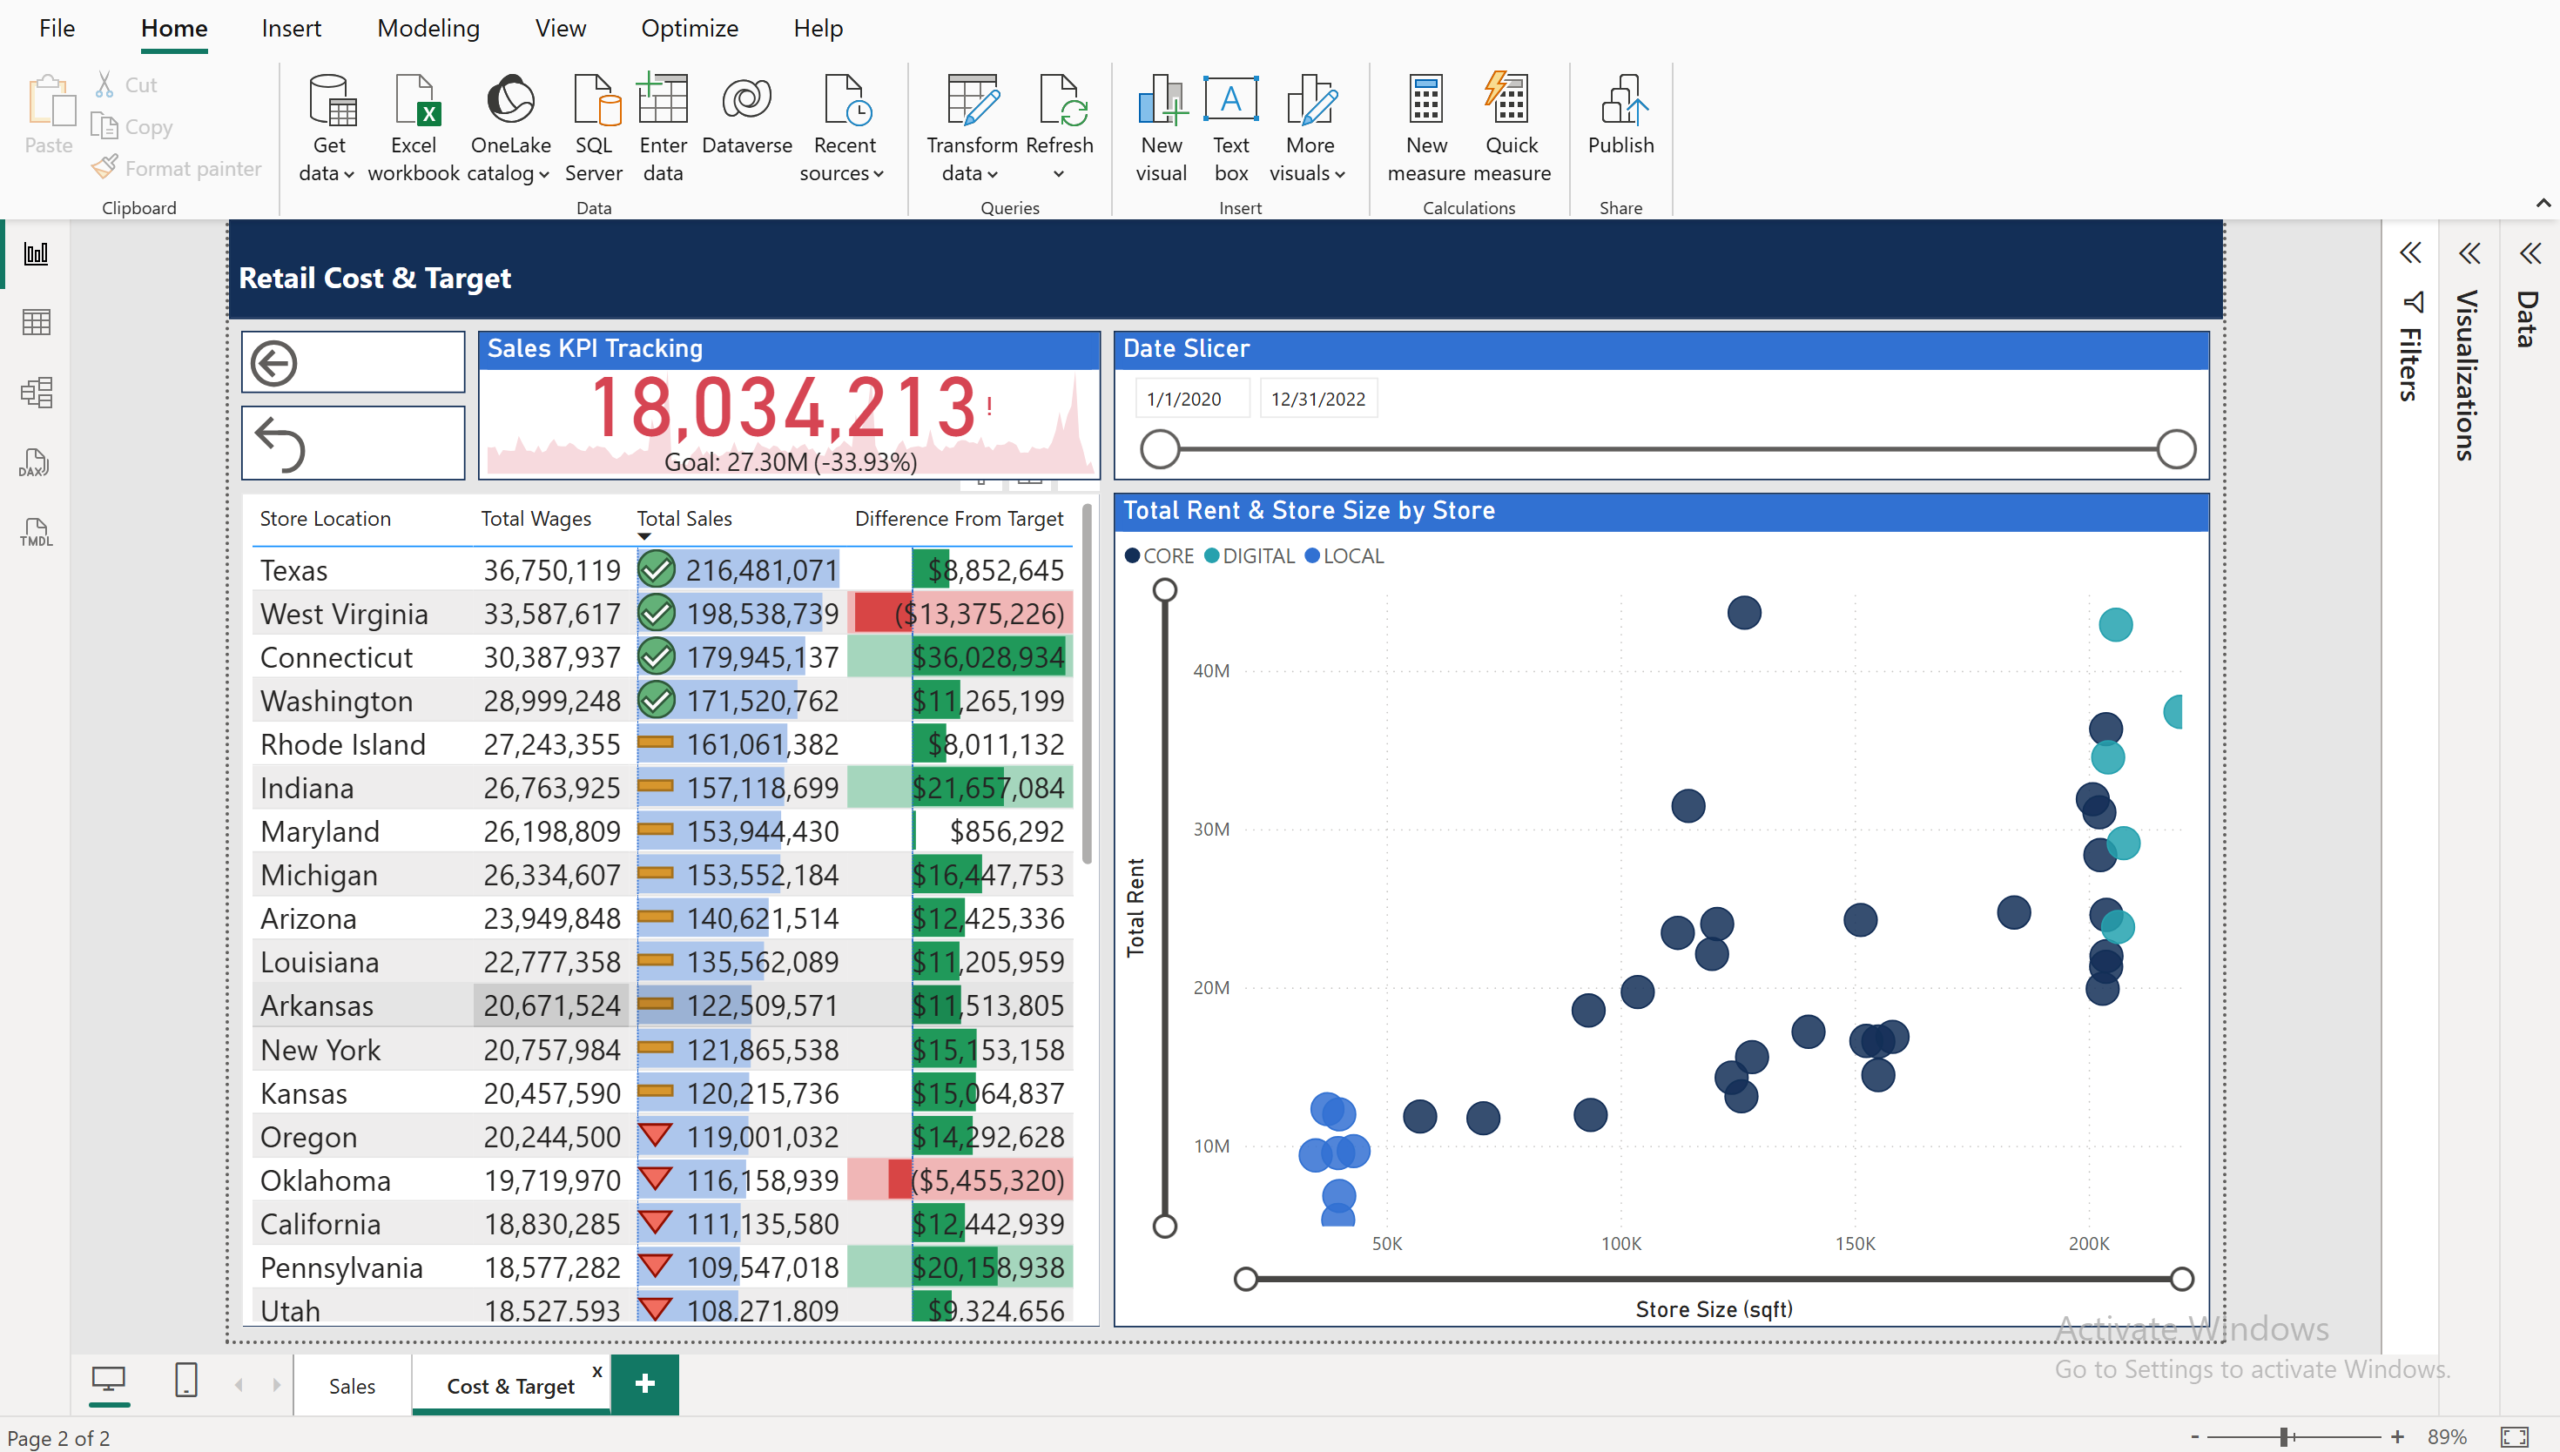
I have Created a Power BI dashboard to monitor sales performance against targets and analyze operational costs by store location. Implemented KPI tracking, date slicers, and conditional formatting to highlight variances from targets, along with a scatter plot to evaluate the relationship between store size and total rent across store types (Core, Digital, Local).https://samad-majidiprojects.website/wp-content/uploads/2025/12/Retail-Cost-project-02-1-scaled.png
-
Project 02.1
I have Developed an interactive Power BI dashboard to analyze retail sales performance by department, store location, and store type. Implemented KPI cards for Total Sales, YTD Sales, and Gross Margin, along with slicers, stacked visuals, and detailed tables to enable dynamic filtering and comparative analysis across regions and channels (Core, Digital, Local).https://samad-majidiprojects.website/wp-content/uploads/2025/12/Retail-Sales-project-02-scaled.png datahttps://samad-majidiprojects.website/wp-content/uploads/2025/12/Date.txt data01https://samad-majidiprojects.website/wp-content/uploads/2025/12/Department-List.xlsx…
-
Project 01
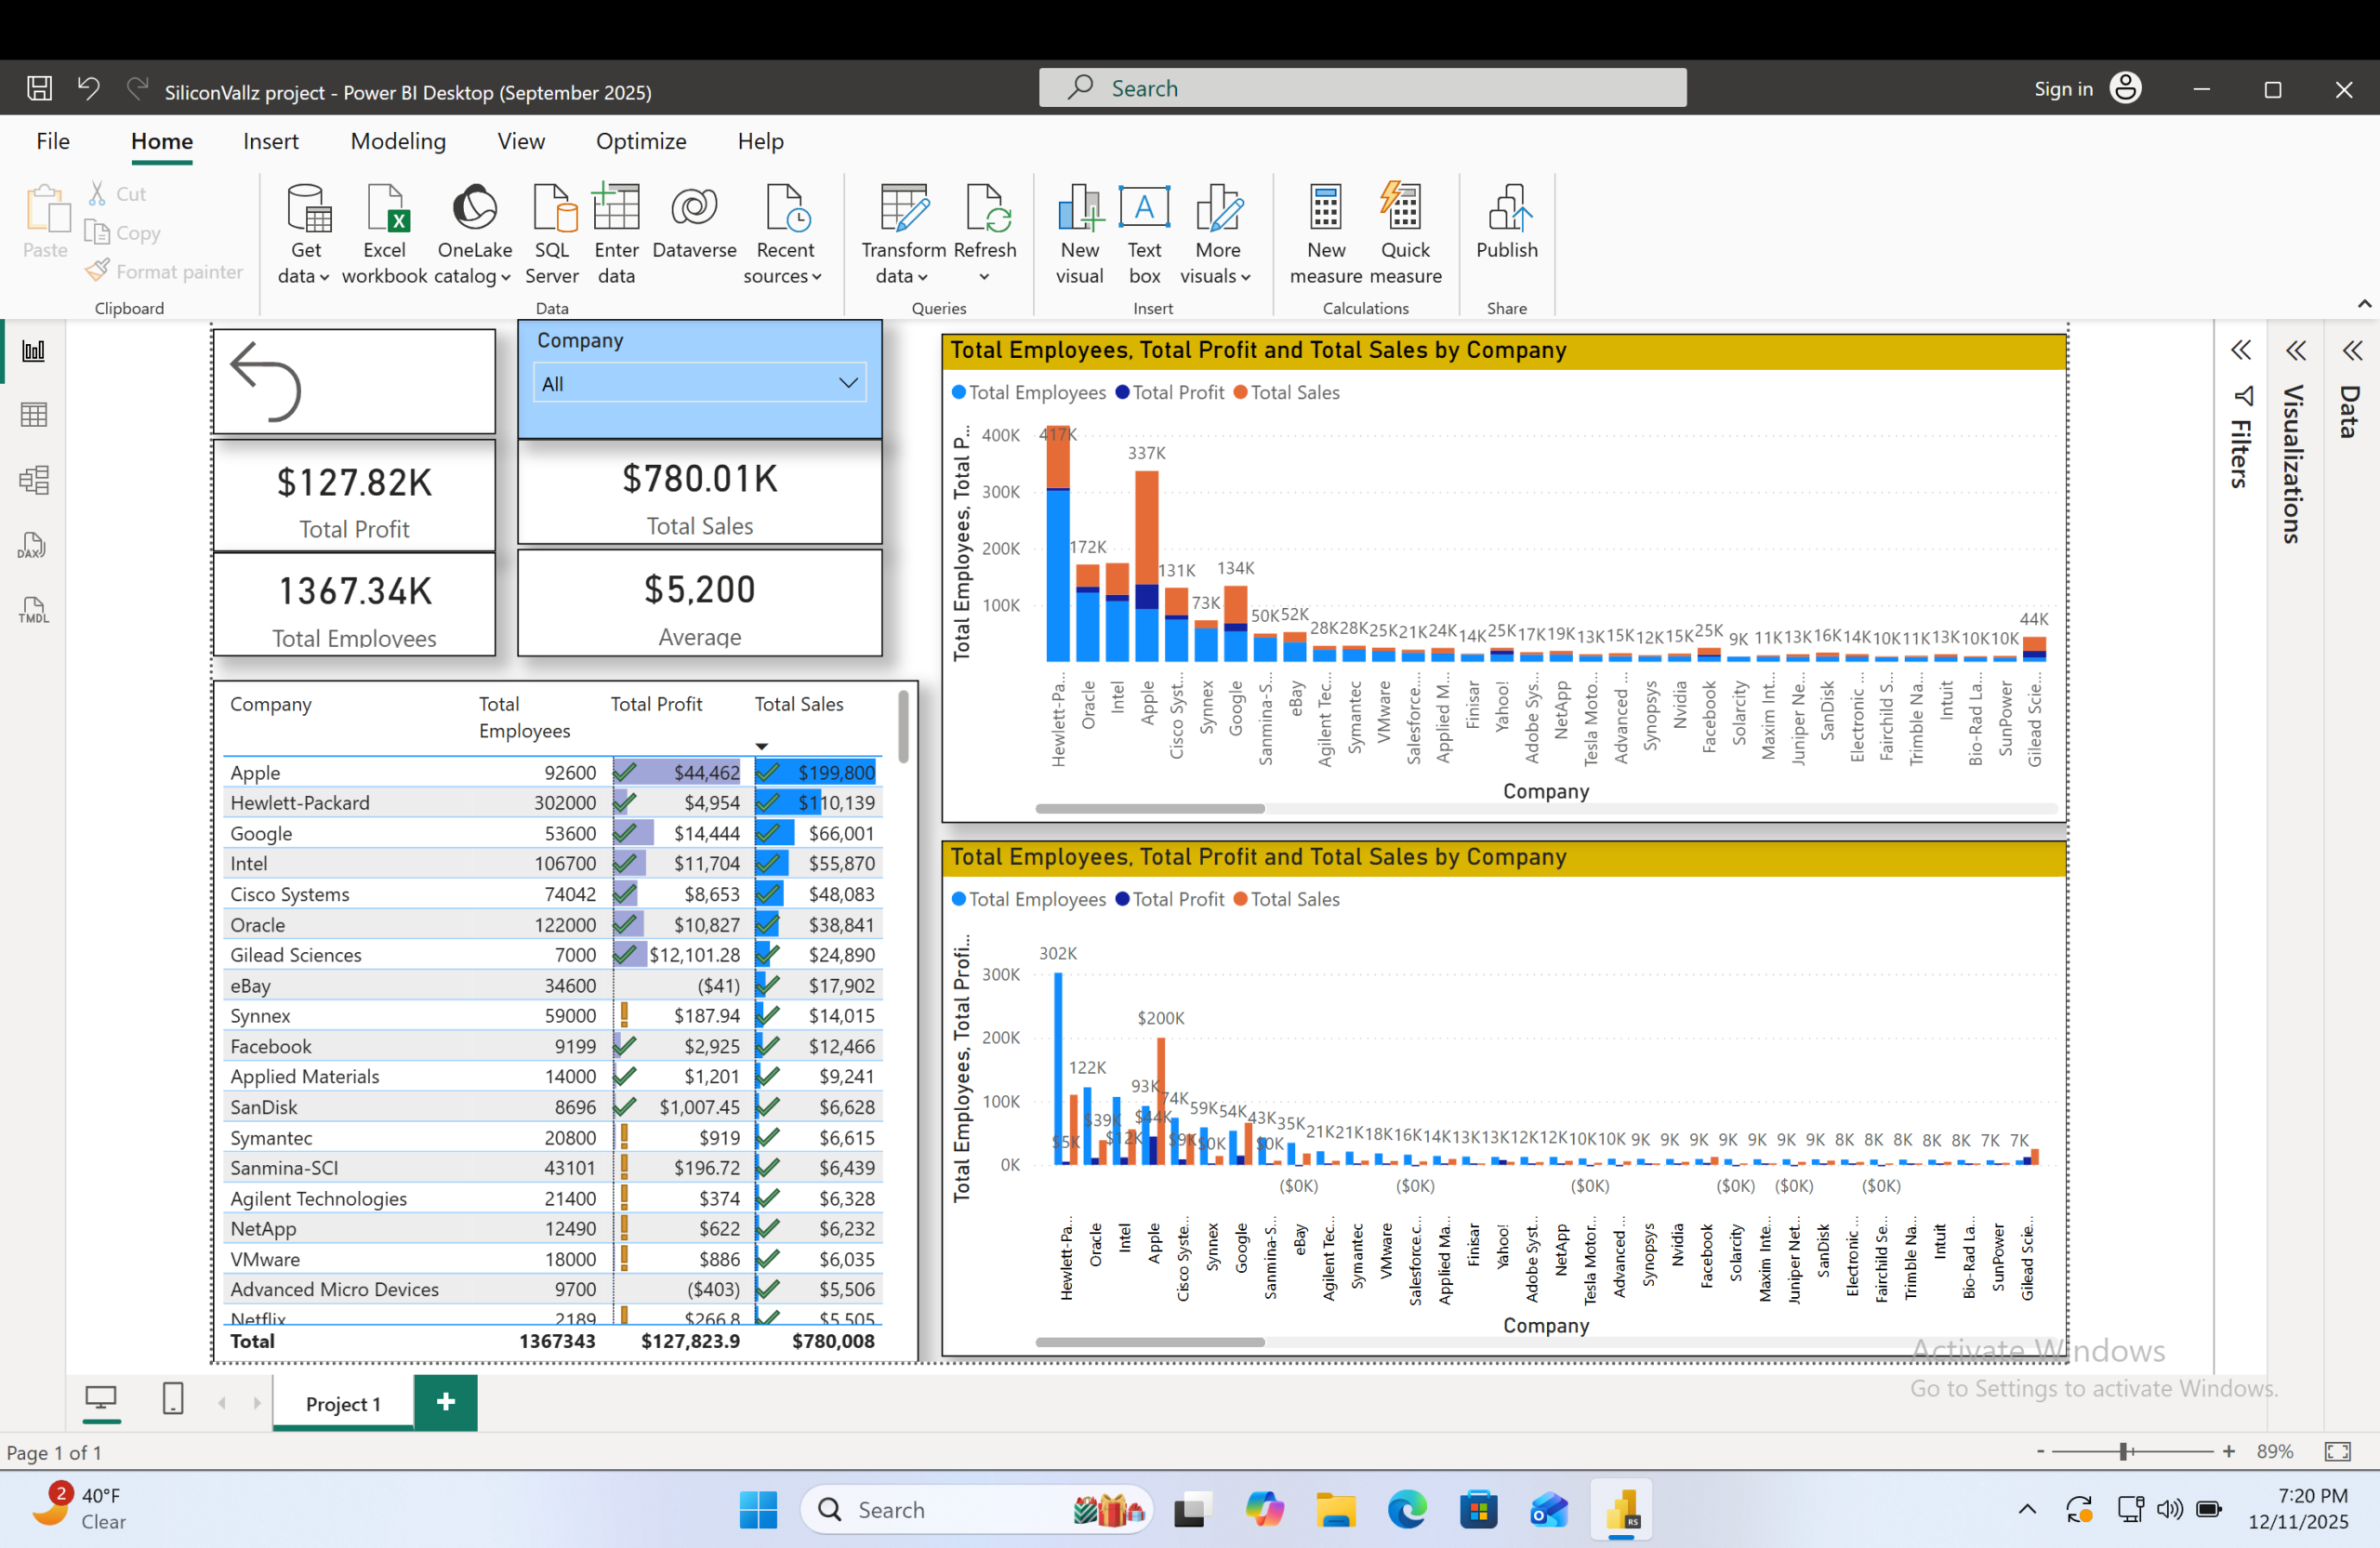
Download https://samad-majidiprojects.website/wp-content/uploads/2025/12/SiliconValley-project-01-scaled.png I have built an interactive Power BI dashboard to analyze company-level performance metrics, including Total Employees, Total Profit, and Total Sales. Implemented KPI cards, company slicers, stacked column charts, and a detail table with conditional formatting to enable dynamic filtering and cross-company comparison. The dashboard supports efficient data exploration and delivers clear, actionable…