

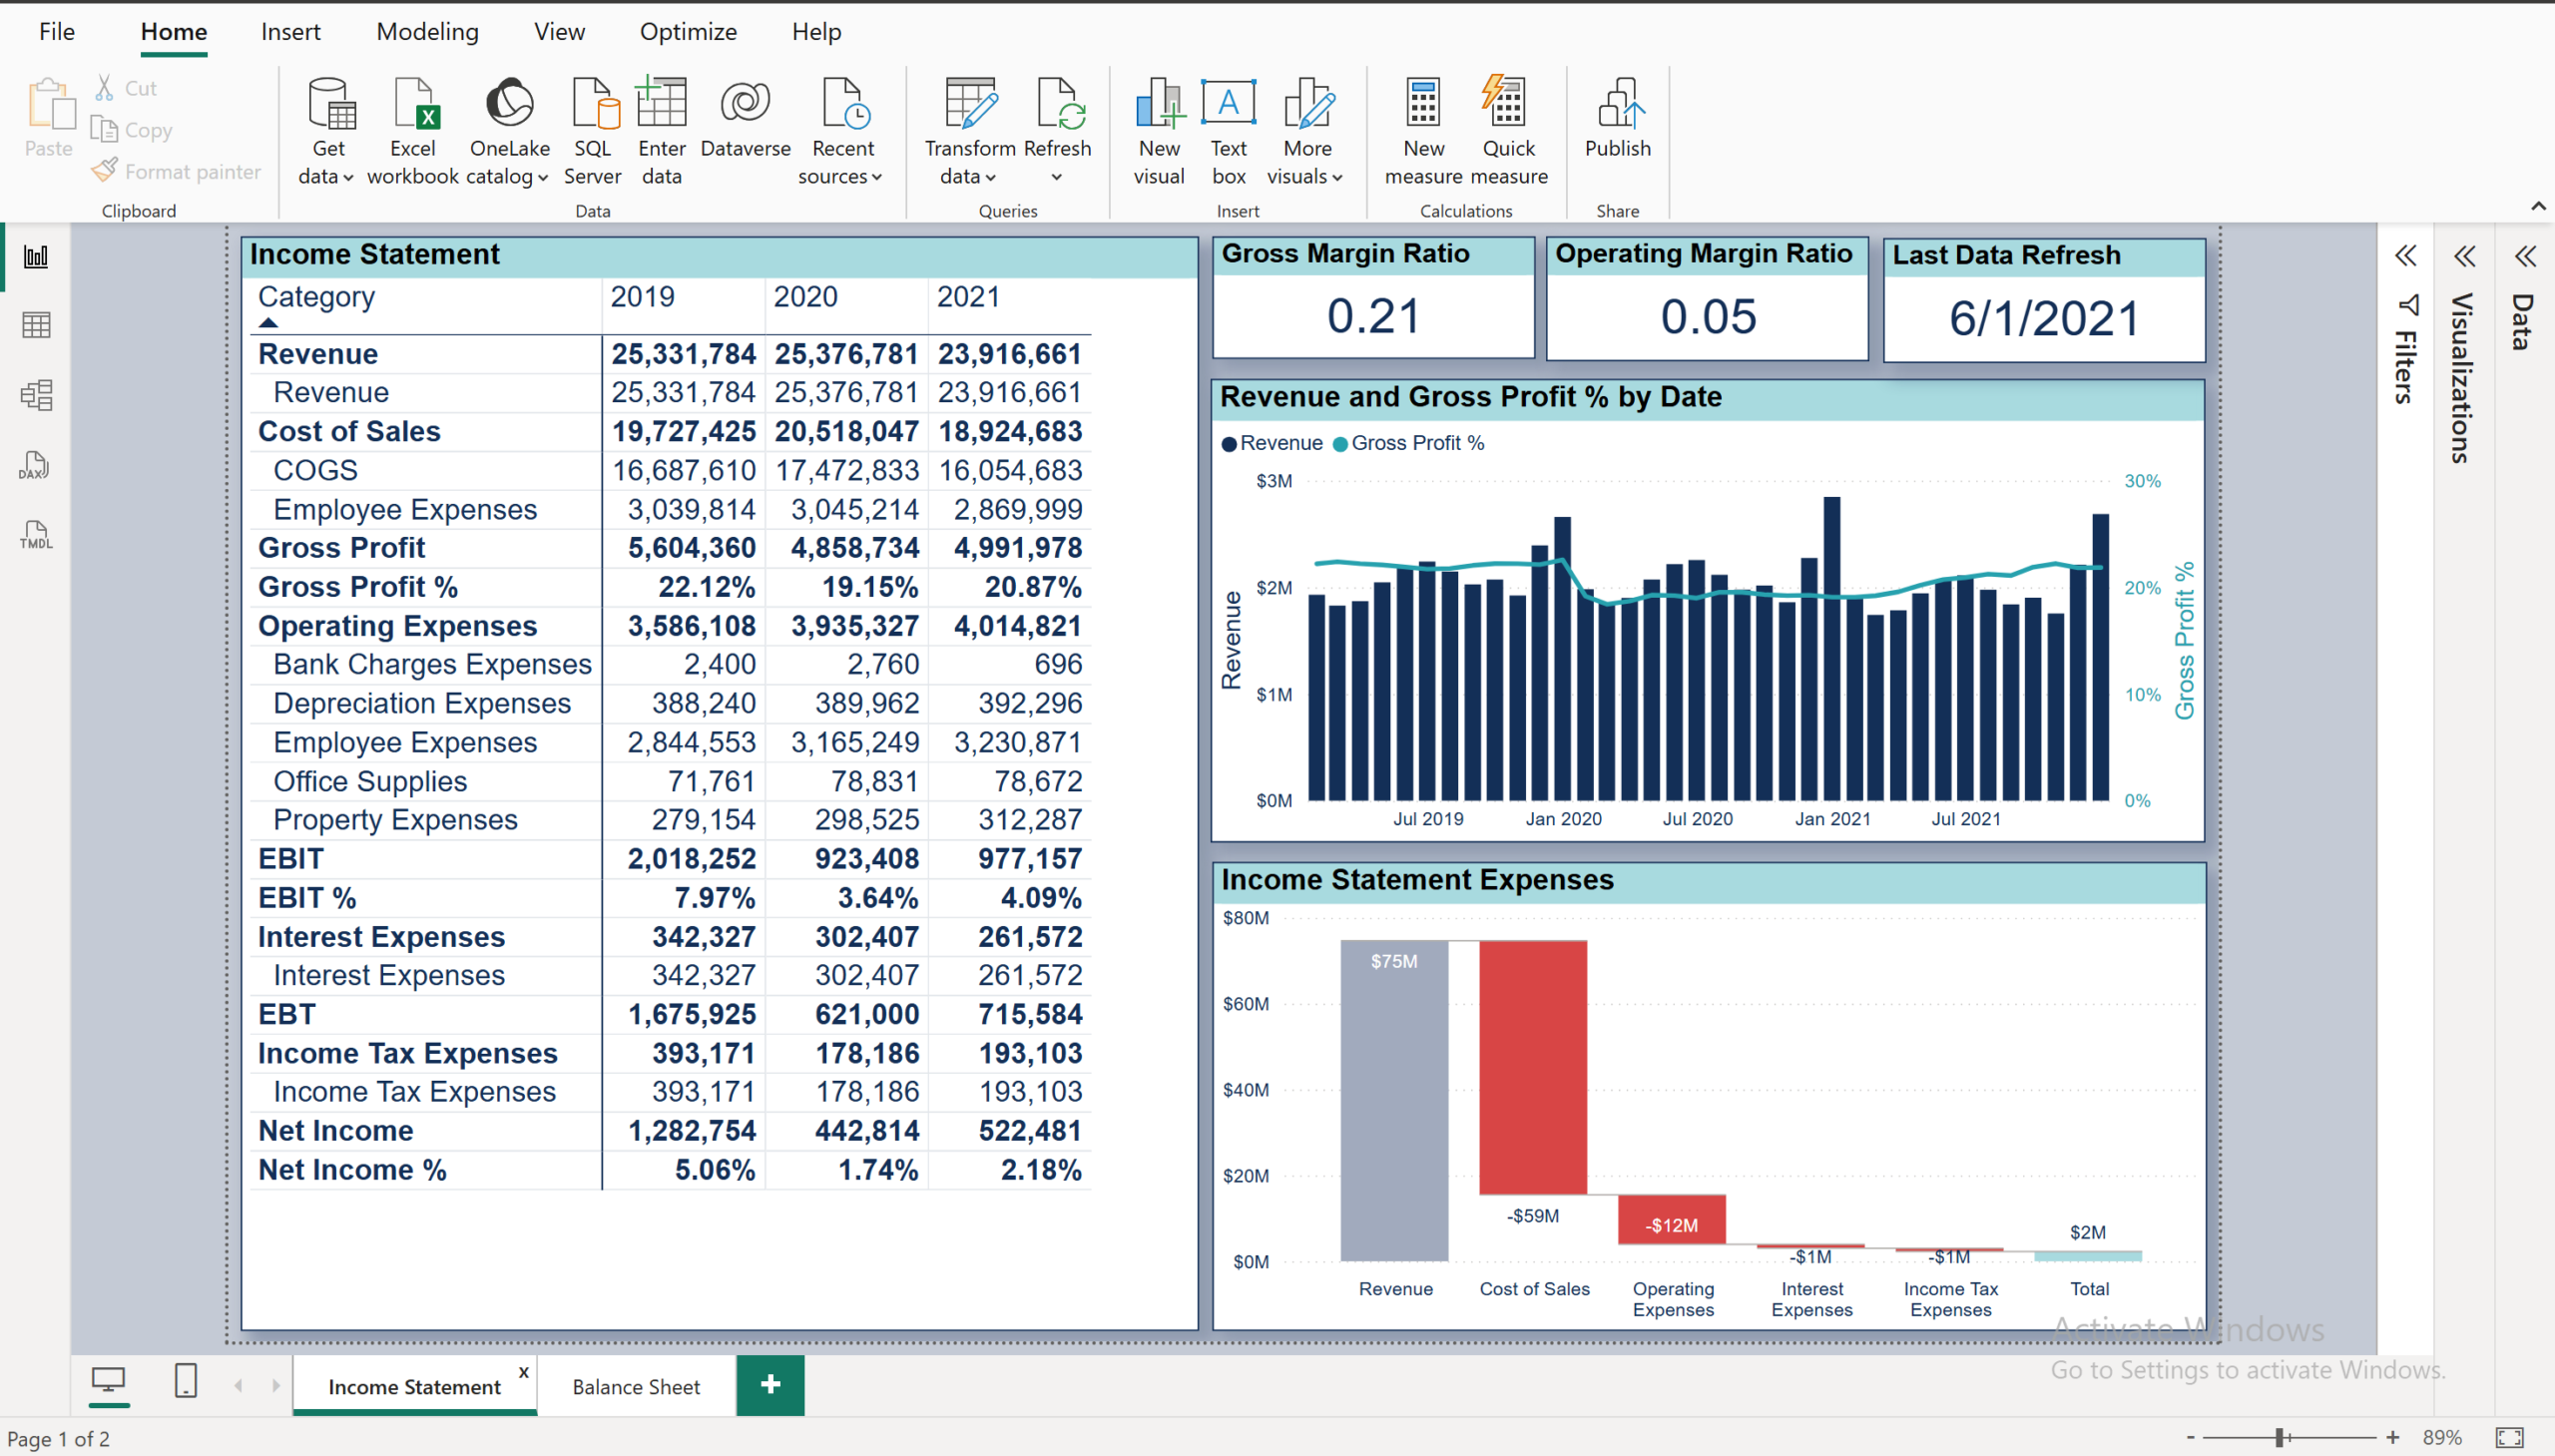
I have created a dynamic Income Statement dashboard using Power BI visualizing financial performance from 2019 to 2021. The dashboard combines a detailed Income Statement table with key figures, highlights vital ratios (Gross Margin: 0.21, Operating Margin: 0.05), and includes visual charts for Revenue/Gross Profit trends and a breakdown of major Expenses.https://samad-majidiprojects.website/wp-content/uploads/2025/12/Income-Statement-project-03-scaled.png
Project 03.1
I have created a dynamic Income Statement dashboard using Power BI visualizing financial performance from 2019 to 2021. The dashboard combines a detailed Income Statement table with key figures, highlights…
