

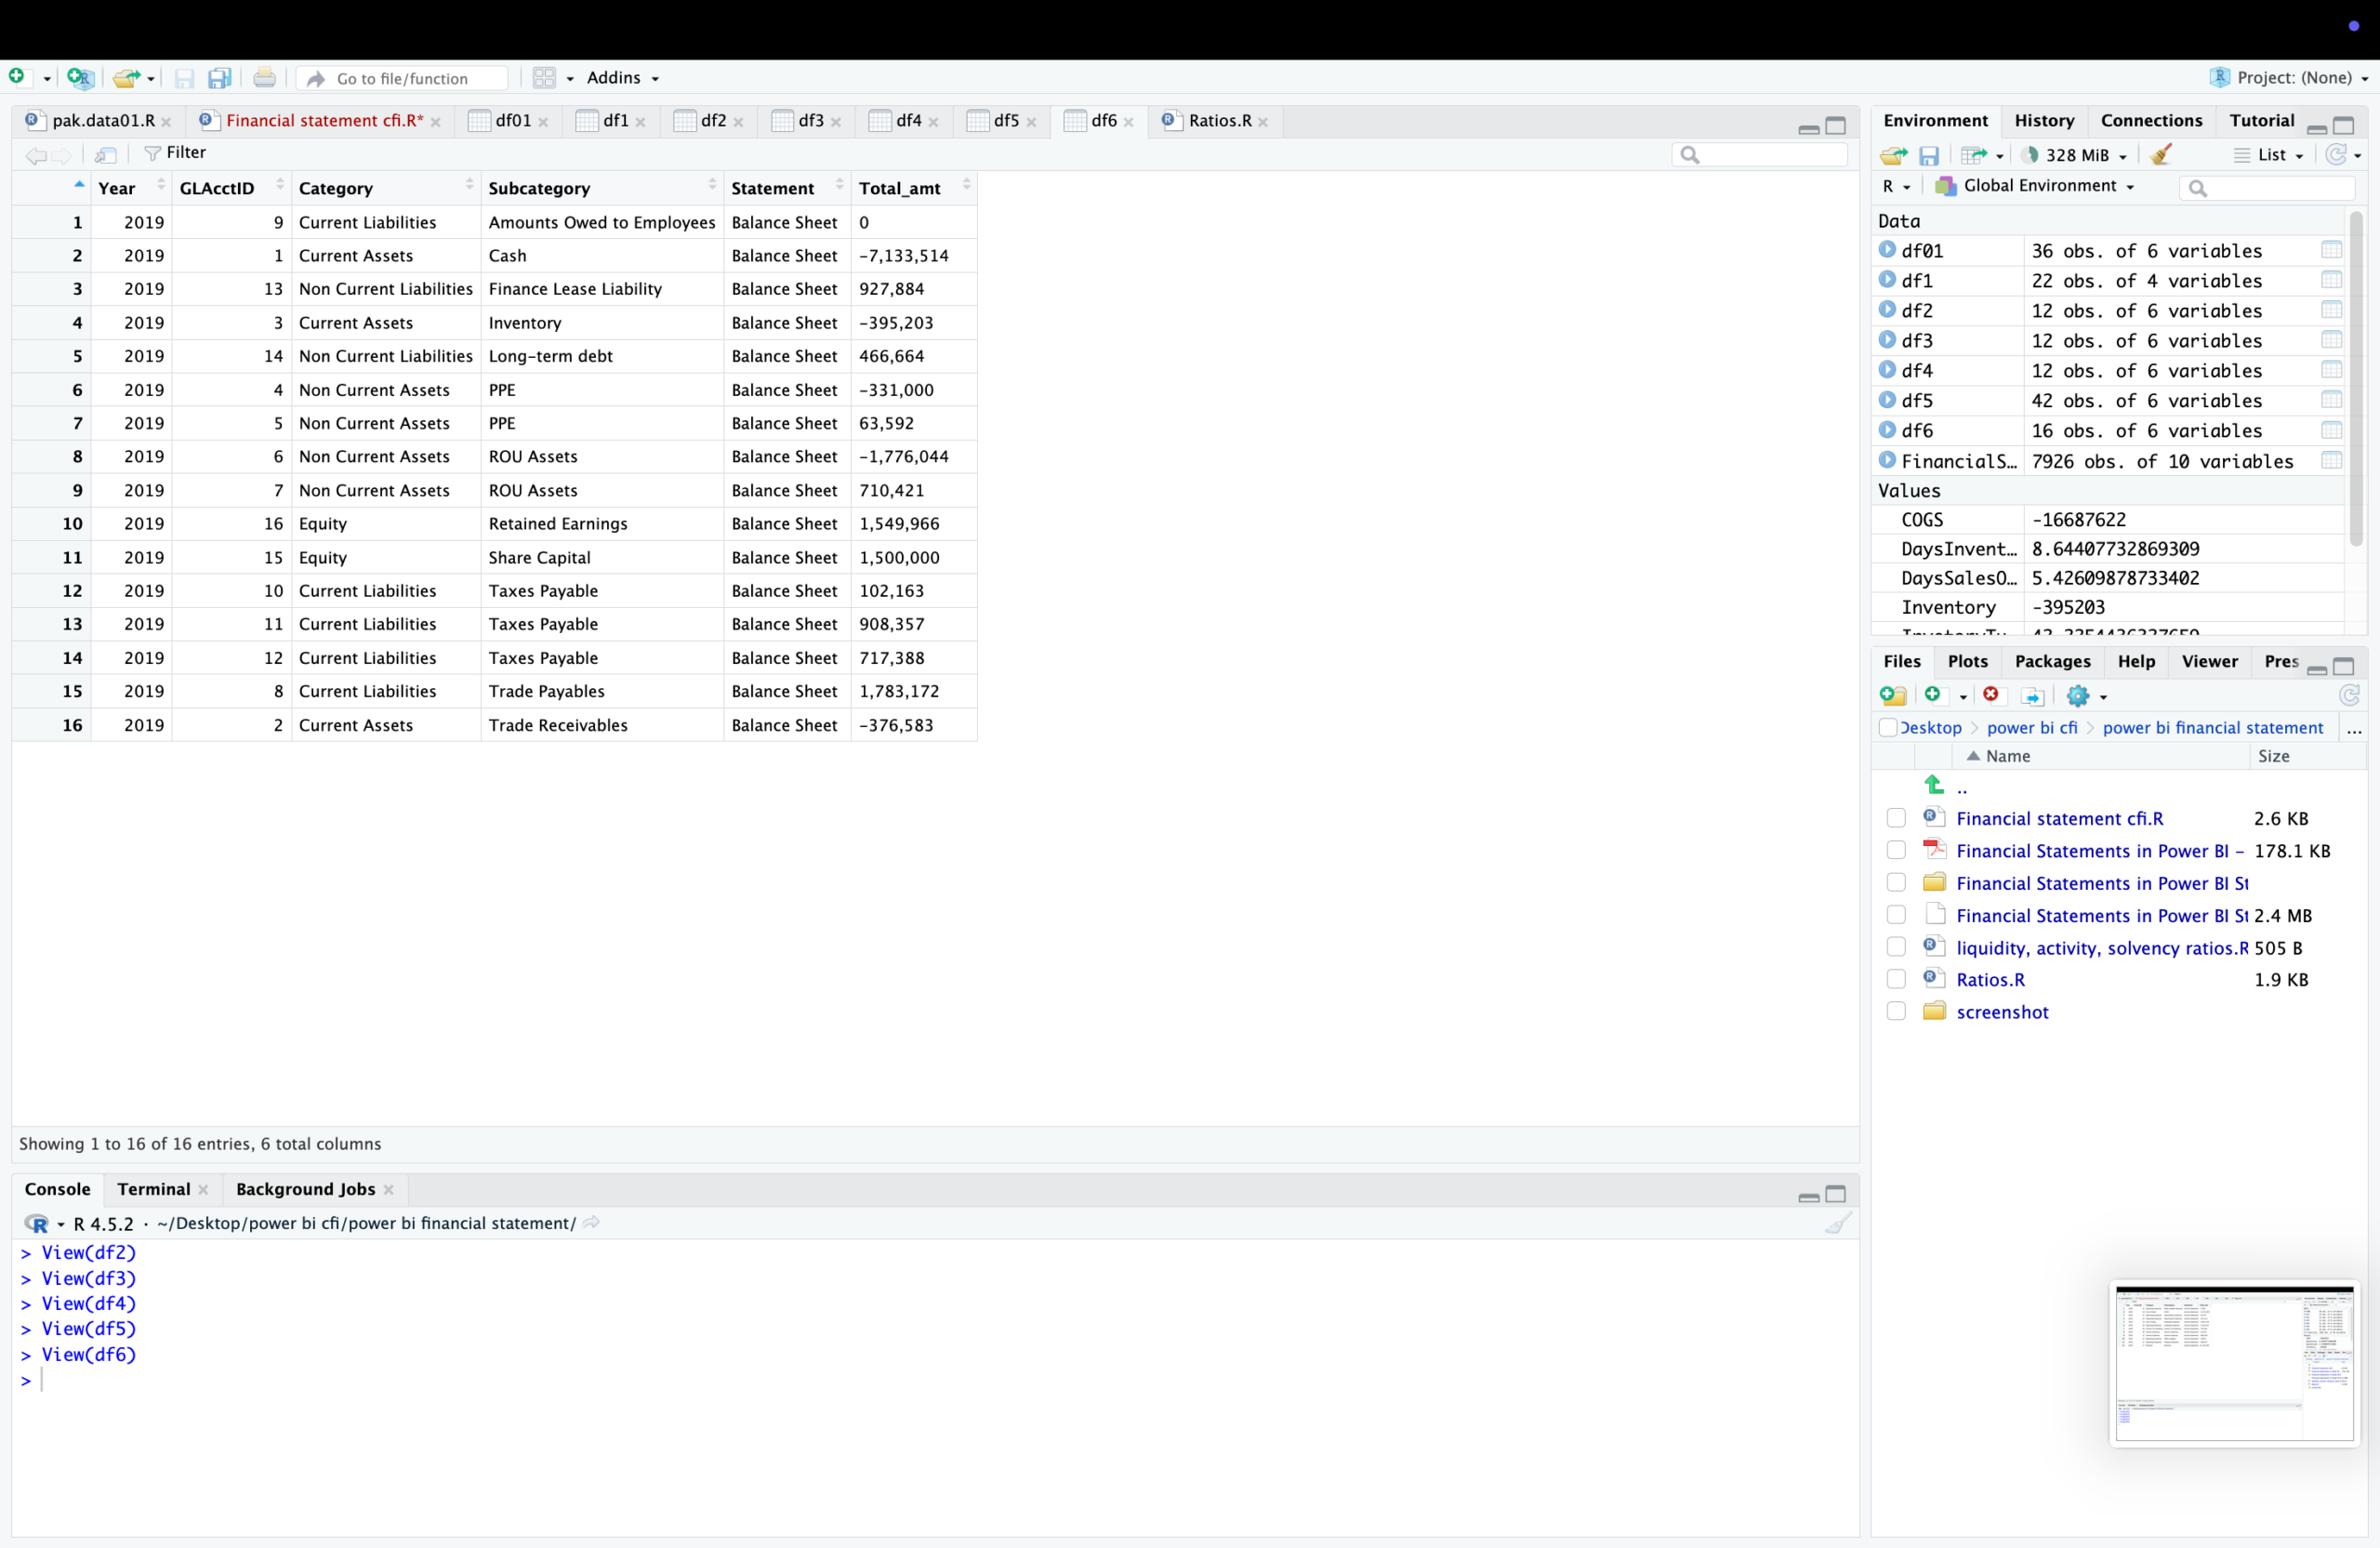
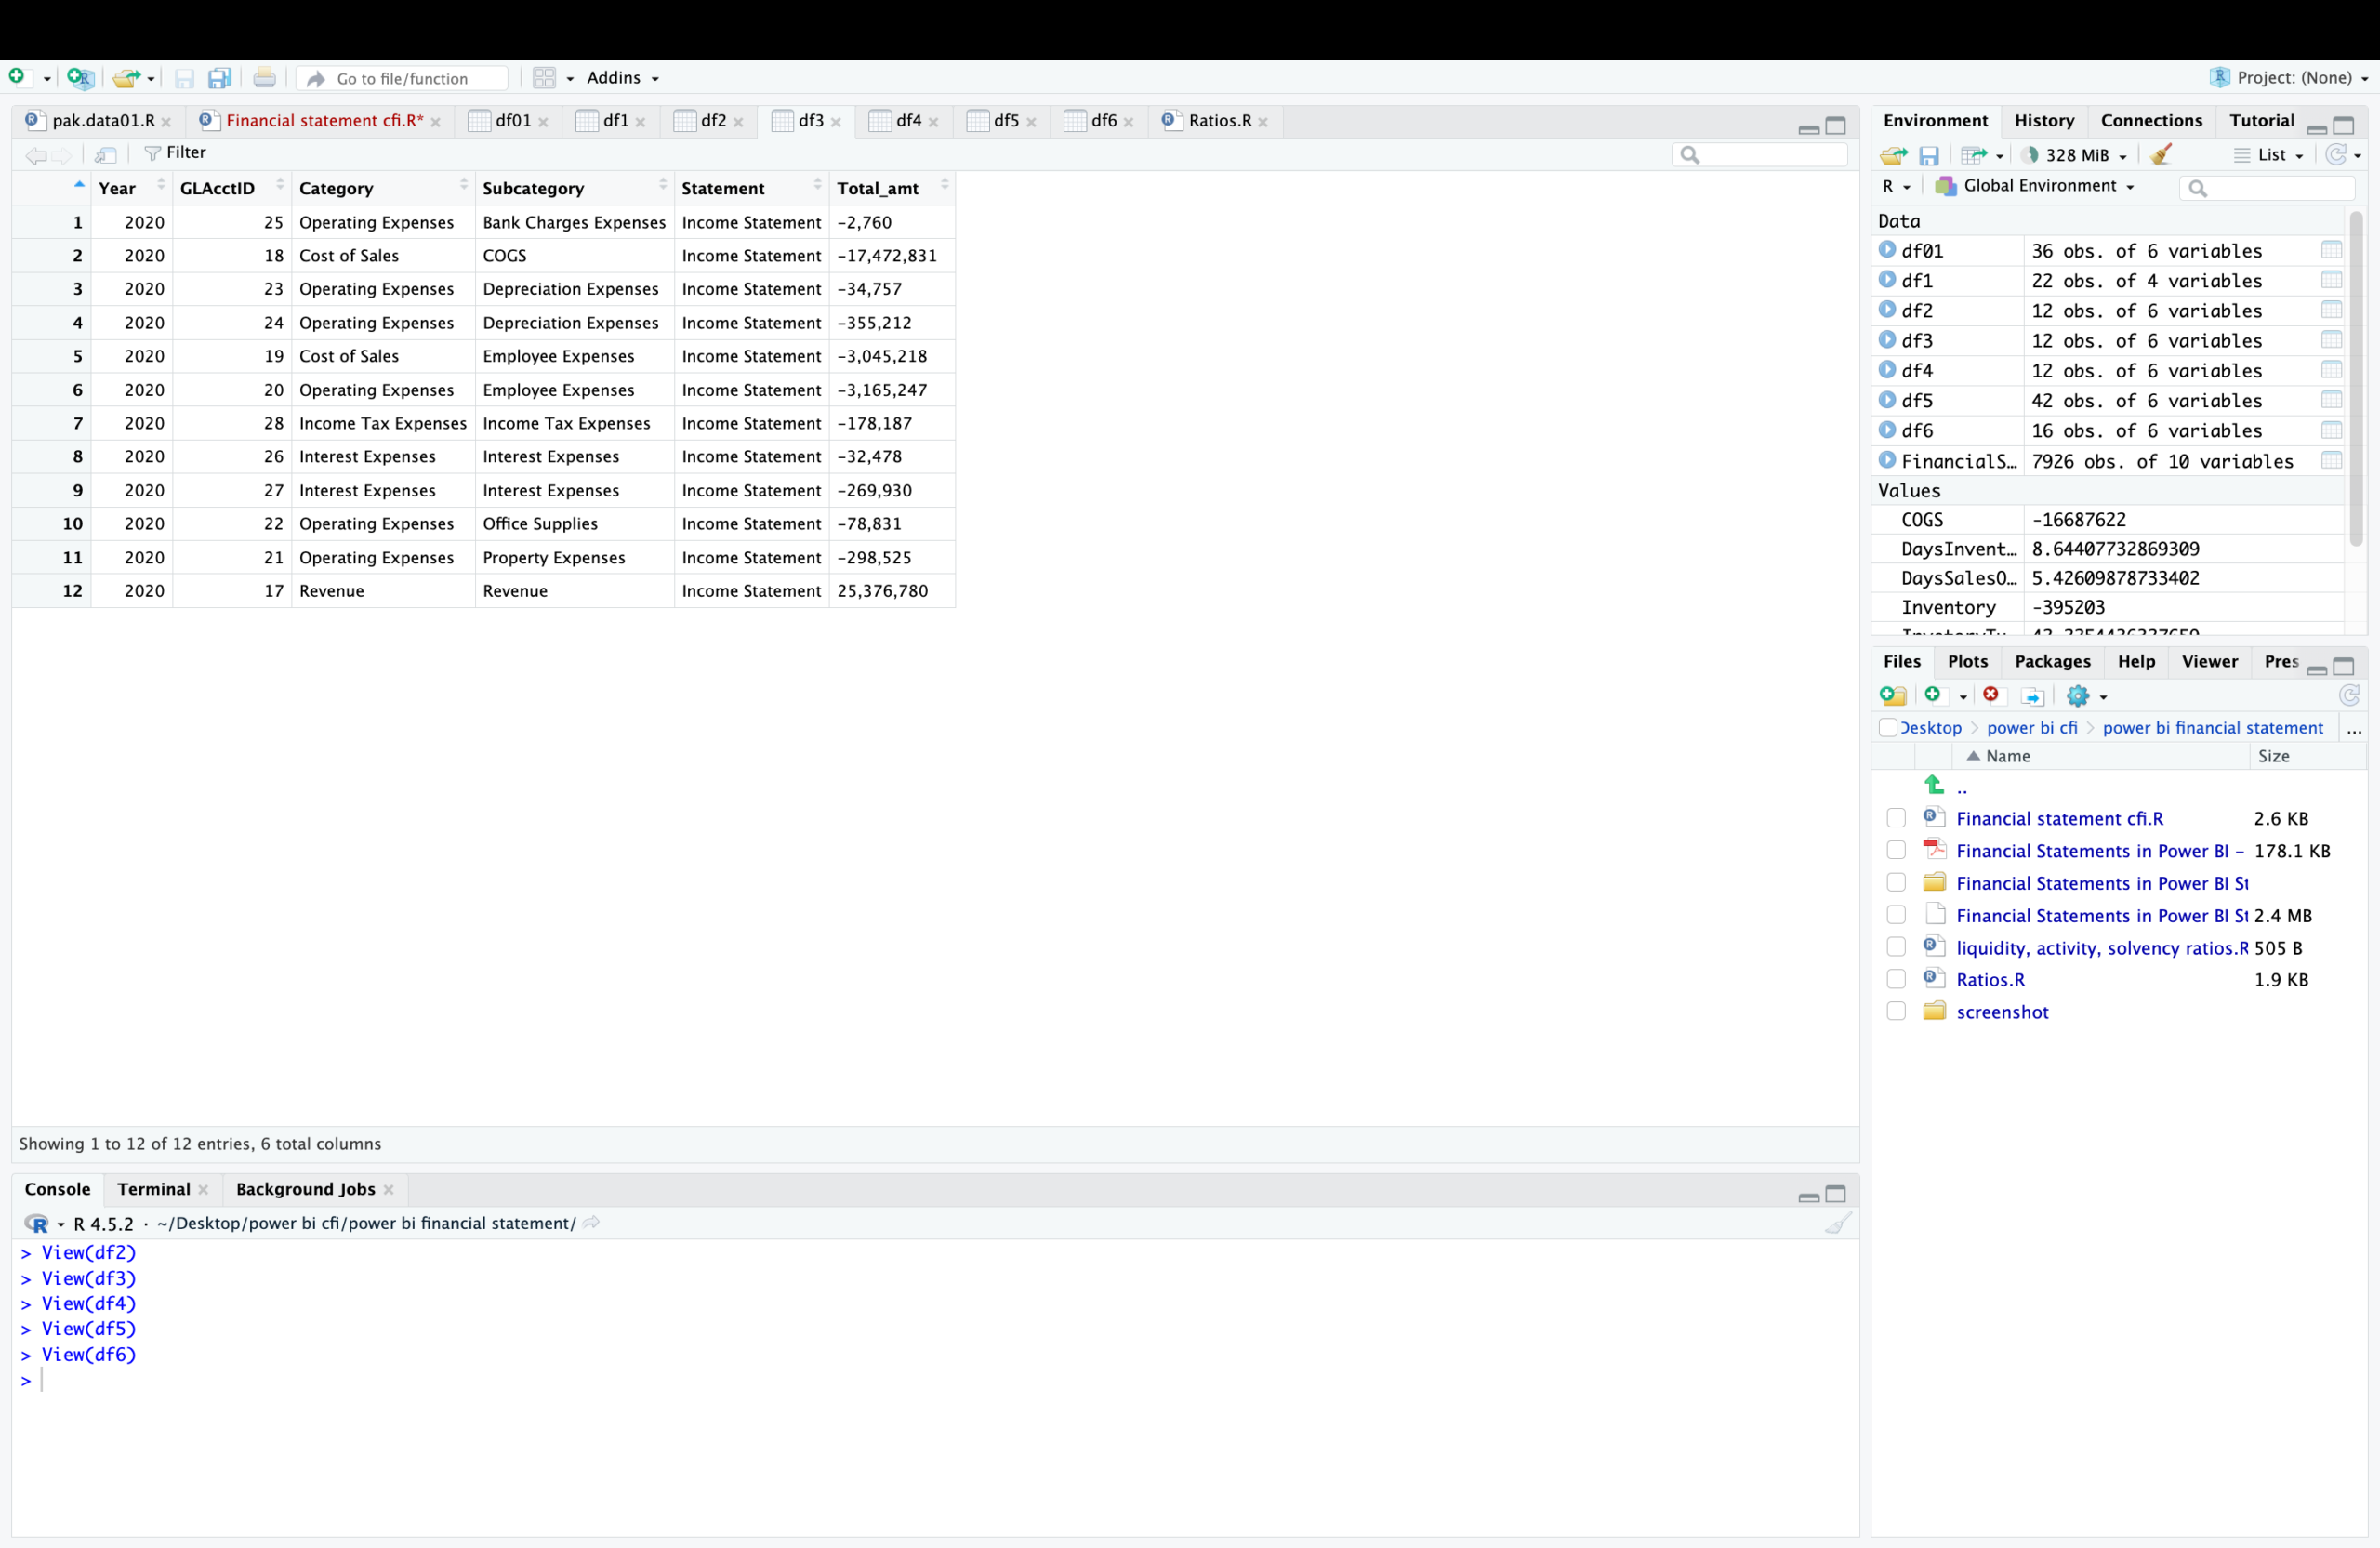
I have used RStudio to explore and clean multiple financial data frames, viewing several intermediate tables before consolidating them into a structured income statement dataset. The data is organized by year, account, category, and subcategory, with revenues and expenses properly signed. Also I have used RStudio to review and organize balance sheet data by viewing a cleaned data frame that classifies accounts by year, GL account ID, category, and subcategory, with amounts mapped to the Balance Sheet. The data captures current and non-current assets, liabilities, and equity items, with standardized signs for balances, and forms part of a consolidated financial dataset prepared for ratio analysis and Power BI reporting.https://samad-majidiprojects.website/wp-content/uploads/2025/12/Screenshot-2025-12-31-at-15.46.03-scaled.webphttps://samad-majidiprojects.website/wp-content/uploads/2025/12/Screenshot-2025-12-31-at-15.46.08-scaled.webp
link for code:https://drive.google.com/file/d/1_9wtAuE-_INsqdUVuys3gI_MhjNiPRqI/view?usp=drive_link