


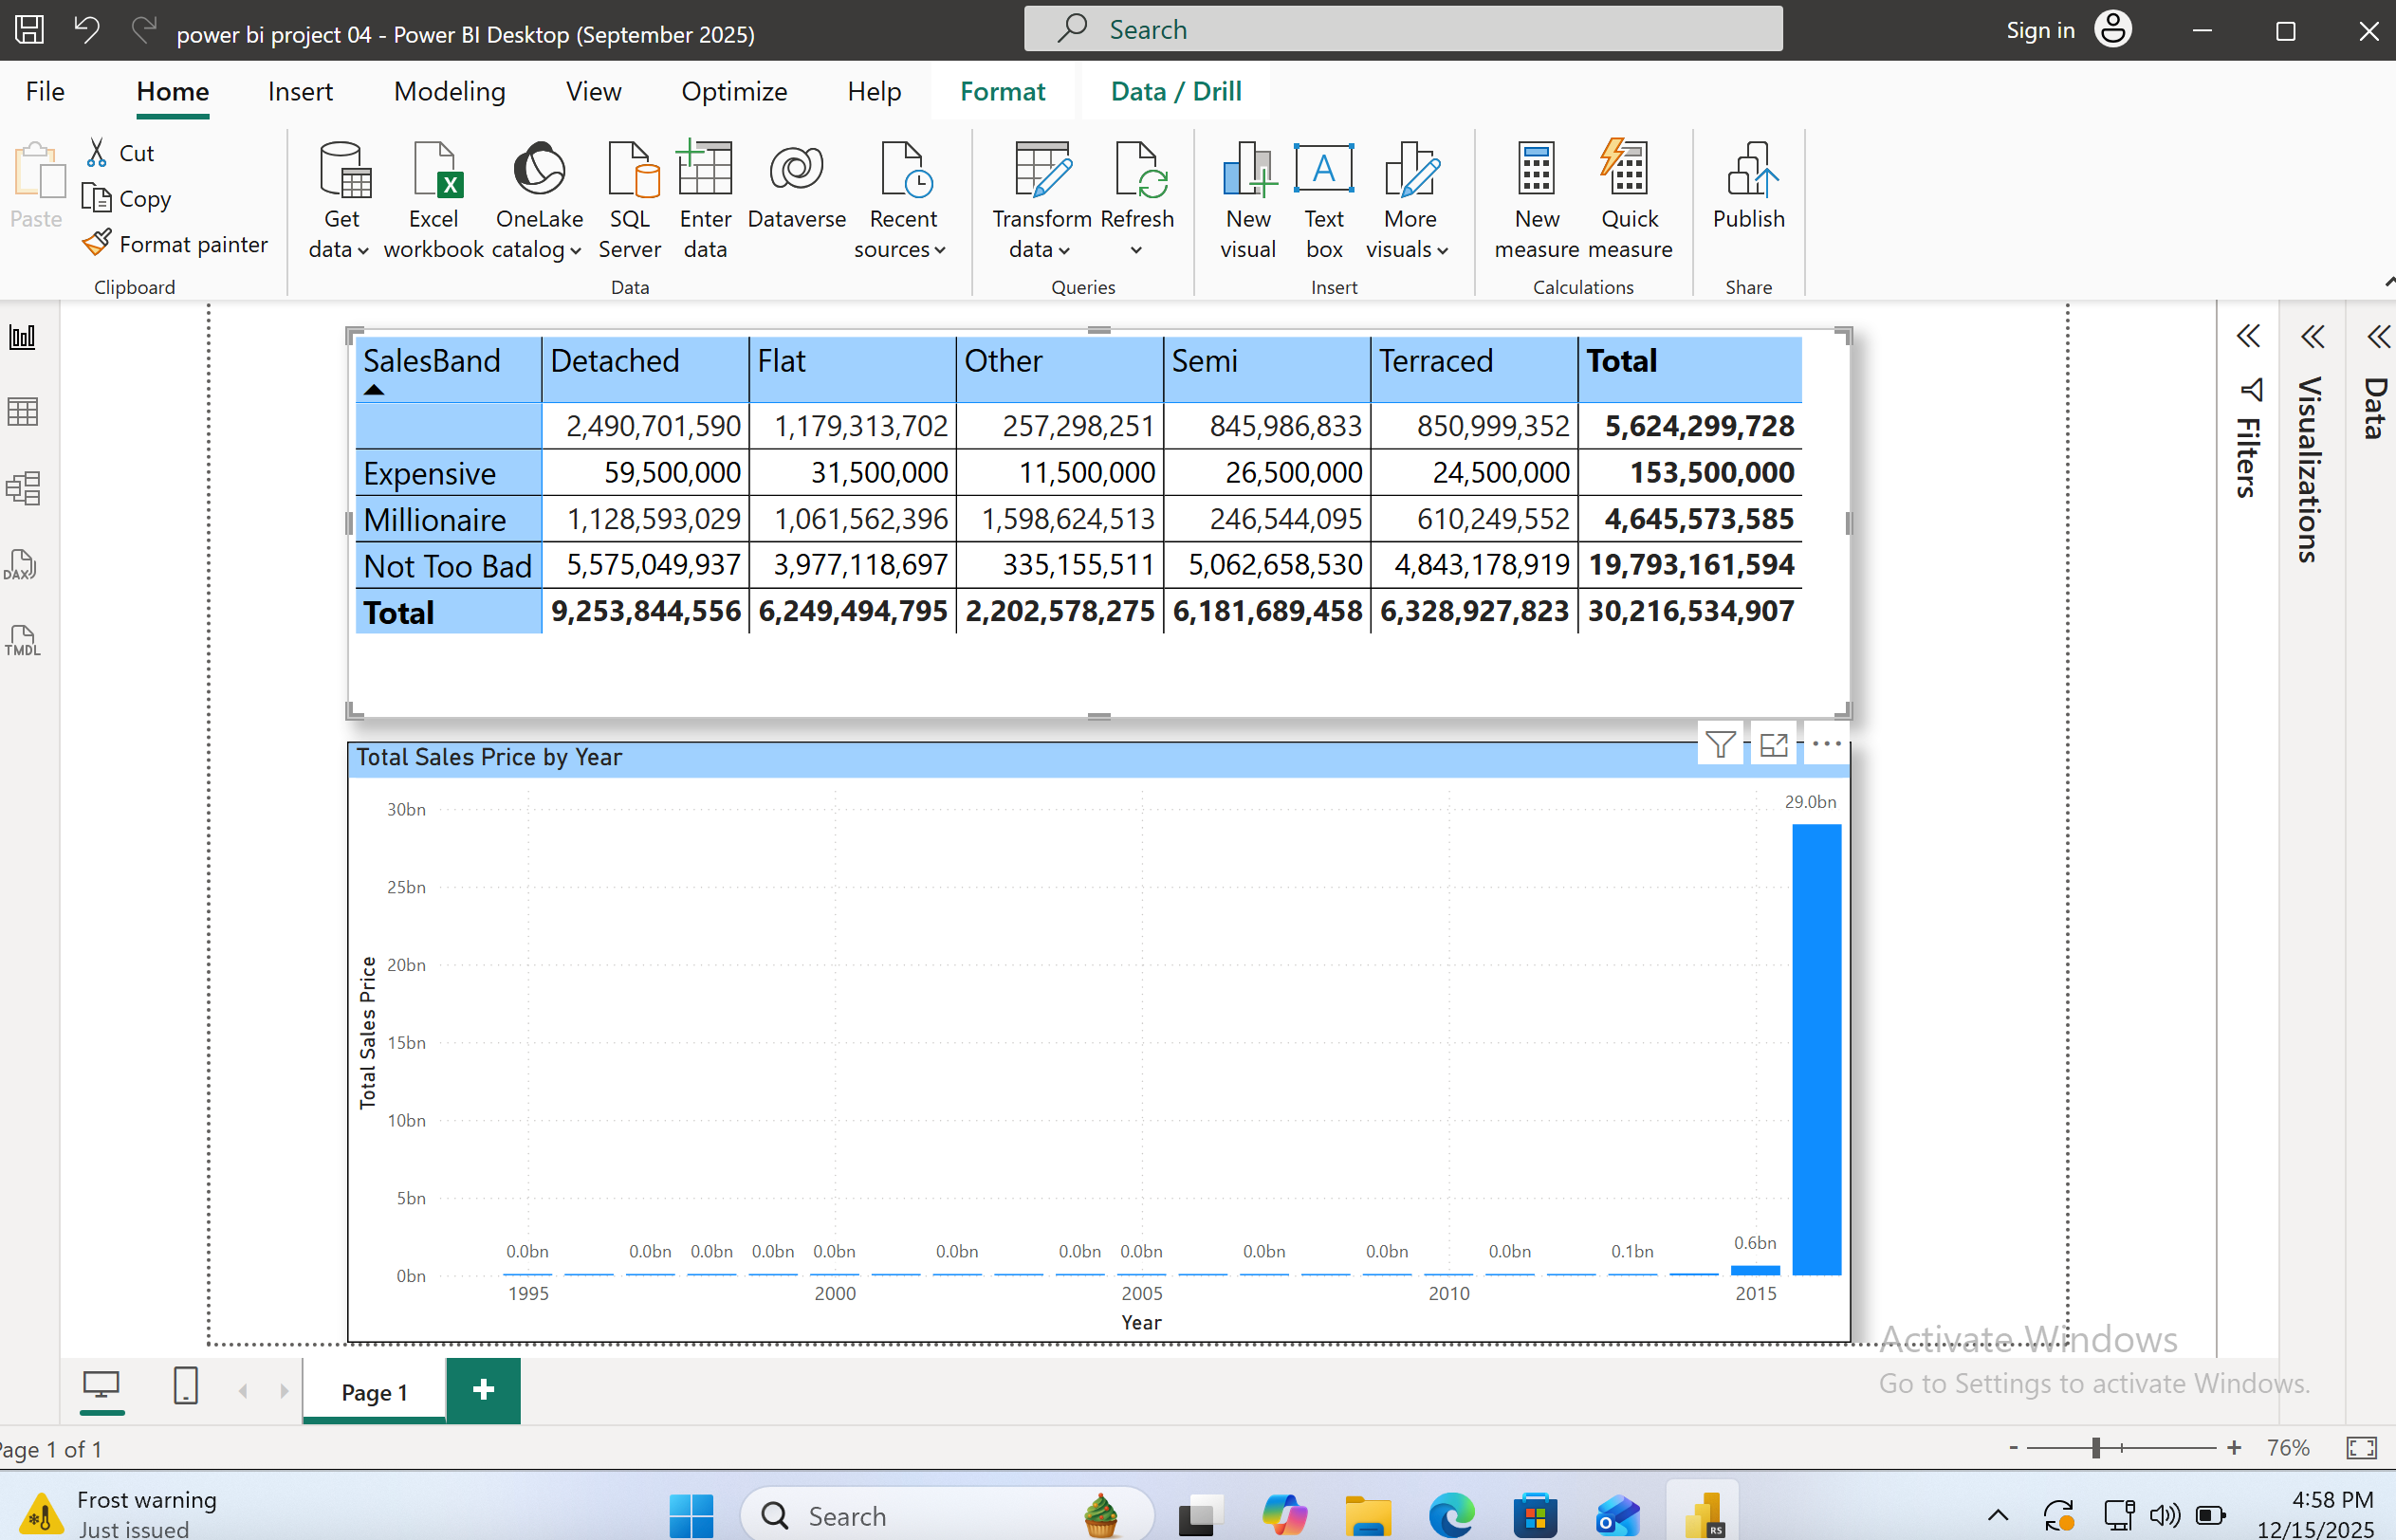
I have generated a concise Sales Performance report, within a business intelligence Power BI. The core of this report is a Matrix table that cross-analyzes Sales Band (Expensive, Millionaire, Not Too Bad) against Property Type (Detached, Flat, Other, Semi, Terraced), showing the total sales price for each combination. This table summarizes the entire sales history, reaching a Total Sales Price of 30,216,534,907. Additionally, the report includes a simple bar chart titled “Total Sales Price by Year” which, while not fully rendered in the image, is intended to visually track the trend of total sales price across the years, likely culminating in a very large value in 2015 based on the visible axis.https://samad-majidiprojects.website/wp-content/uploads/2025/12/Screenshot-2025-12-15-at-16.58.40.png
data https://samad-majidiprojects.website/wp-content/uploads/2025/12/House-price-data-September-2016.xlsx