
Uncategorized
-
Project 6 (SQL Server)
I have used SQL Server Management Studio to query a financial data warehouse, extracting summarized income statement data by year, GL account, category, and subcategory. The query aggregates transaction amounts into a clean, ordered result set that standardizes revenues and expenses, producing a structured income statement table that serves as the source layer for downstream
-
Project 5 (RStudio )
I have used RStudio to explore and clean multiple financial data frames, viewing several intermediate tables before consolidating them into a structured income statement dataset. The data is organized by year, account, category, and subcategory, with revenues and expenses properly signed. Also I have used RStudio to review and organize balance sheet data by viewing
-
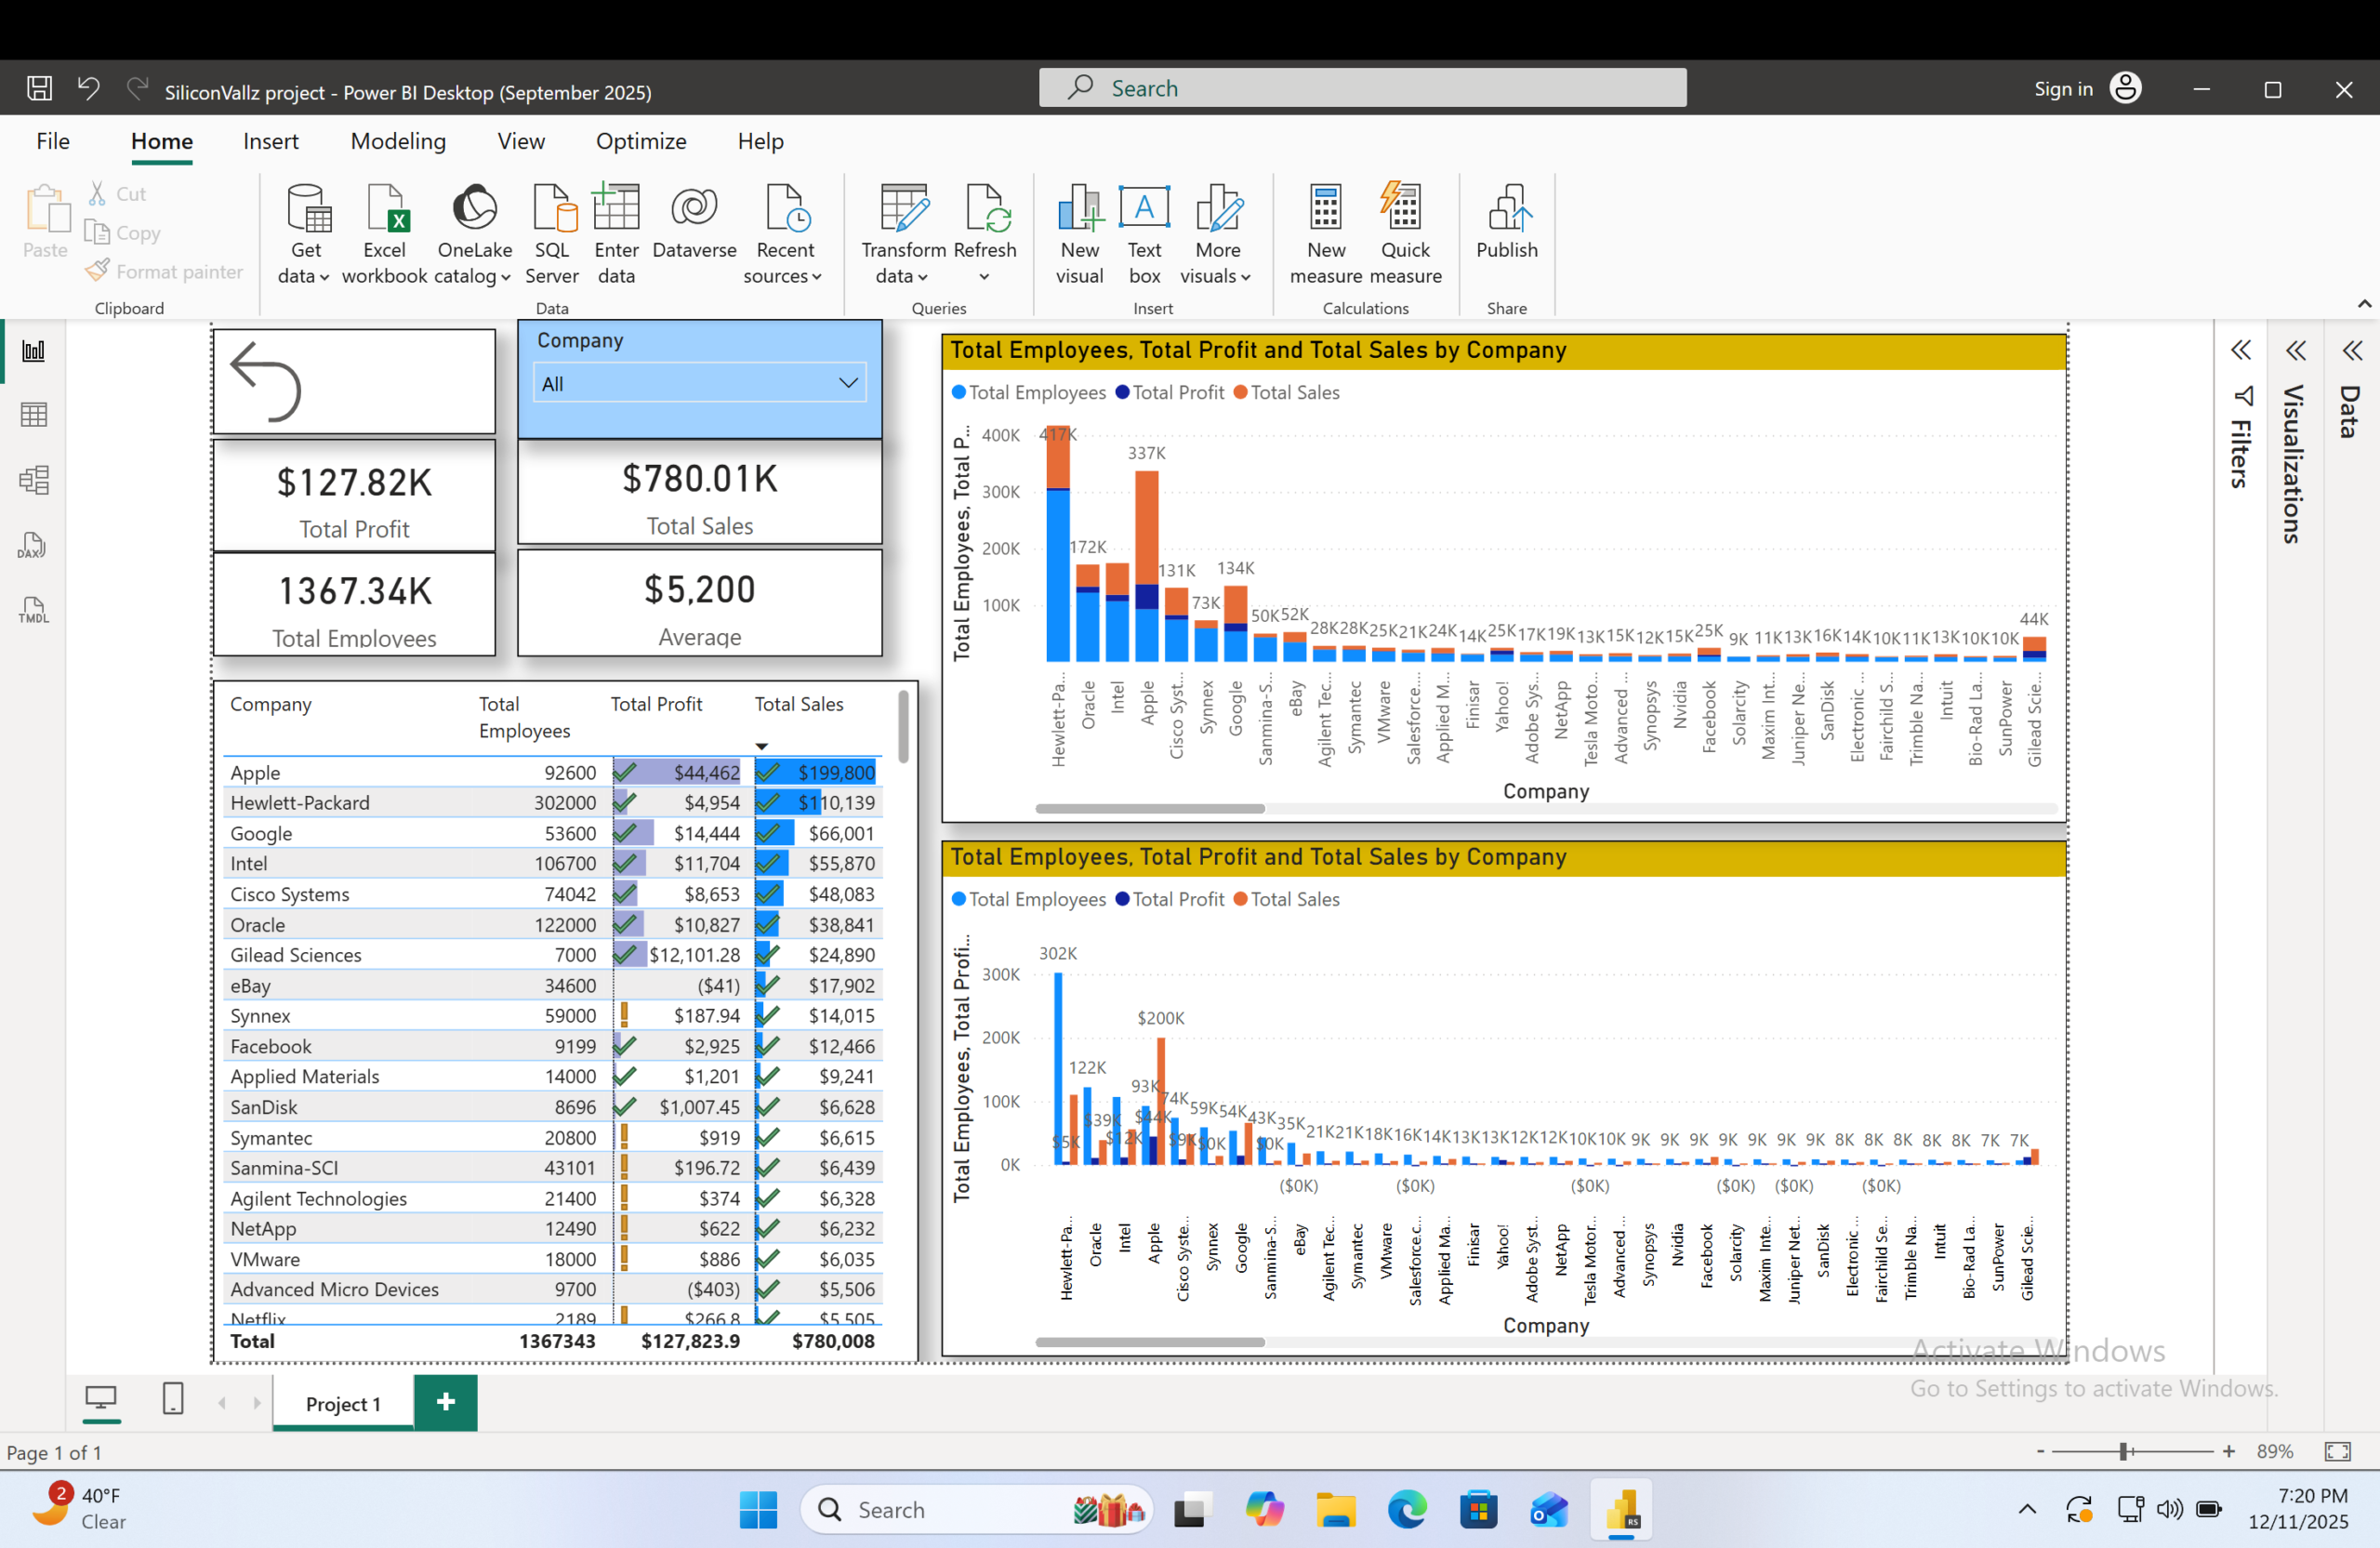
Project 01
Download https://samad-majidiprojects.website/wp-content/uploads/2025/12/SiliconValley-project-01-scaled.png I have built an interactive Power BI dashboard to analyze company-level performance metrics, including Total Employees, Total Profit, and Total Sales. Implemented KPI cards, company slicers, stacked column charts, and a detail table with conditional formatting to enable dynamic filtering and cross-company comparison. The dashboard supports efficient data exploration and delivers clear, actionable