
Download https://samad-majidiprojects.website/wp-content/uploads/2025/12/SiliconValley-project-01-scaled.png
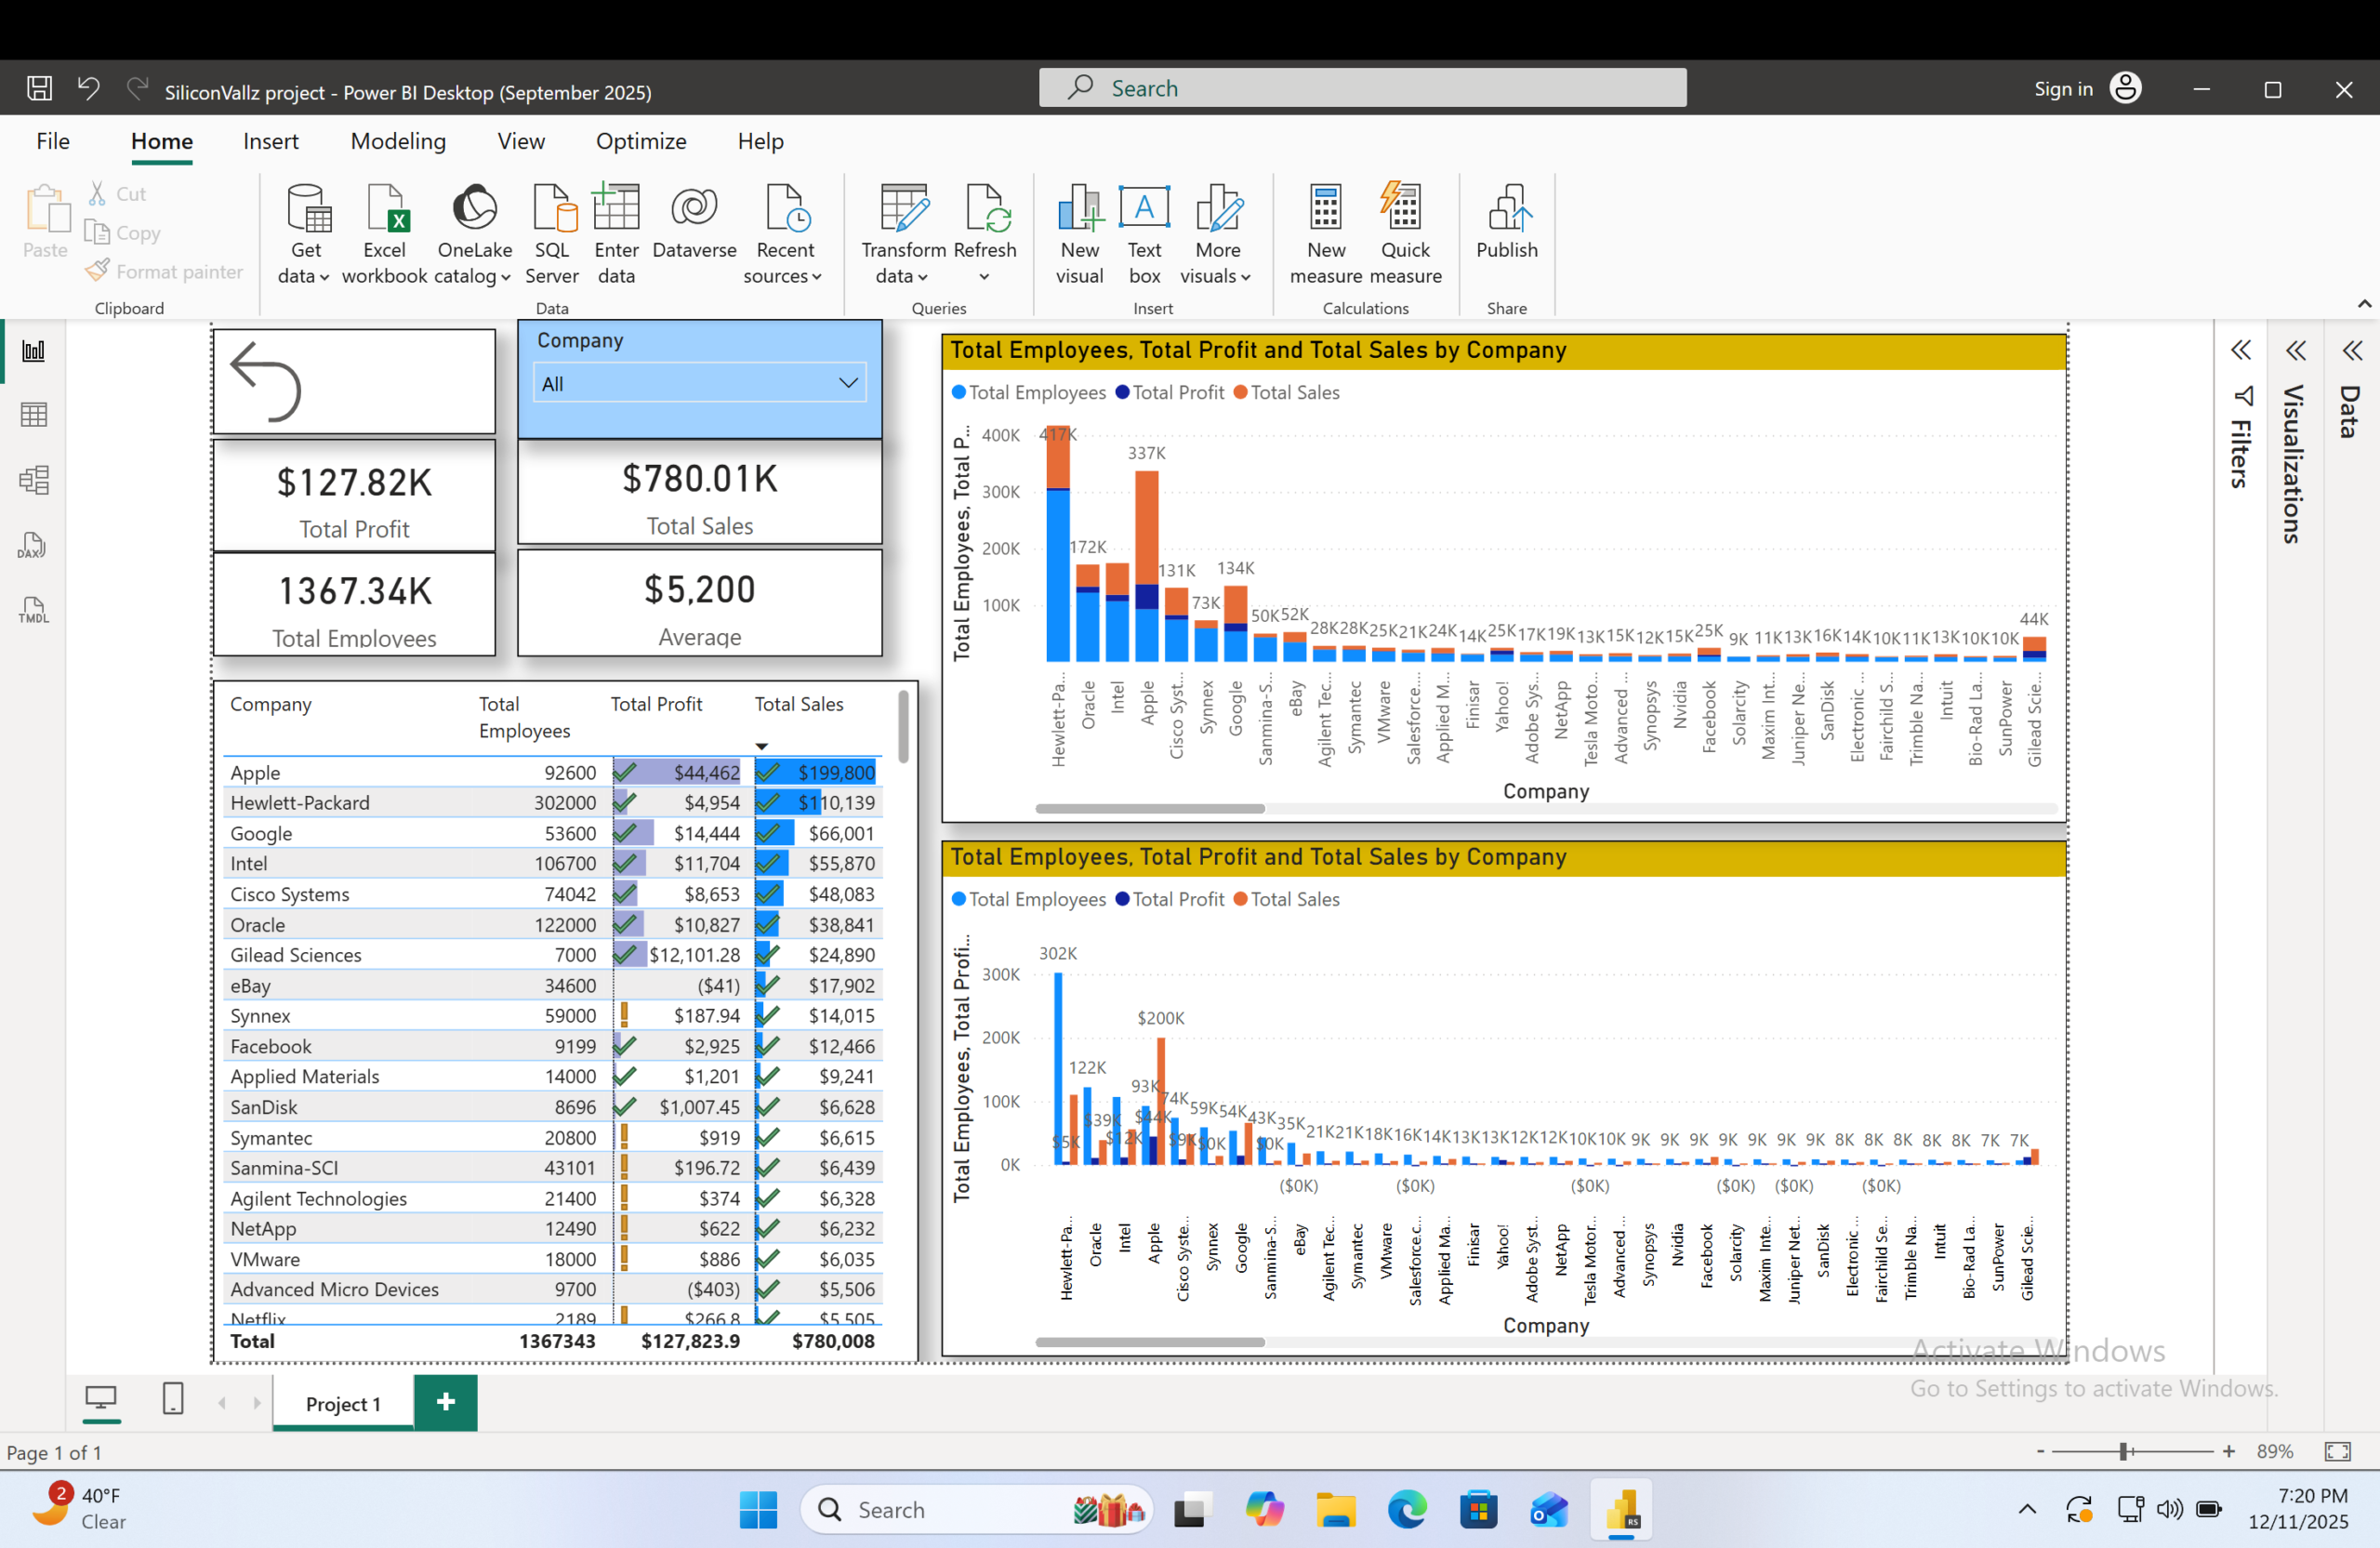
I have built an interactive Power BI dashboard to analyze company-level performance metrics, including Total Employees, Total Profit, and Total Sales. Implemented KPI cards, company slicers, stacked column charts, and a detail table with conditional formatting to enable dynamic filtering and cross-company comparison. The dashboard supports efficient data exploration and delivers clear, actionable insights into organizational scale and financial performance.
data for project 01https://samad-majidiprojects.website/wp-content/uploads/2025/12/SiliconValley-1.xlsx